I needed to show these simulations as part of my movie, so I constructed two devices enabling me to show what was happening in real time on the face of an oscilloscope.
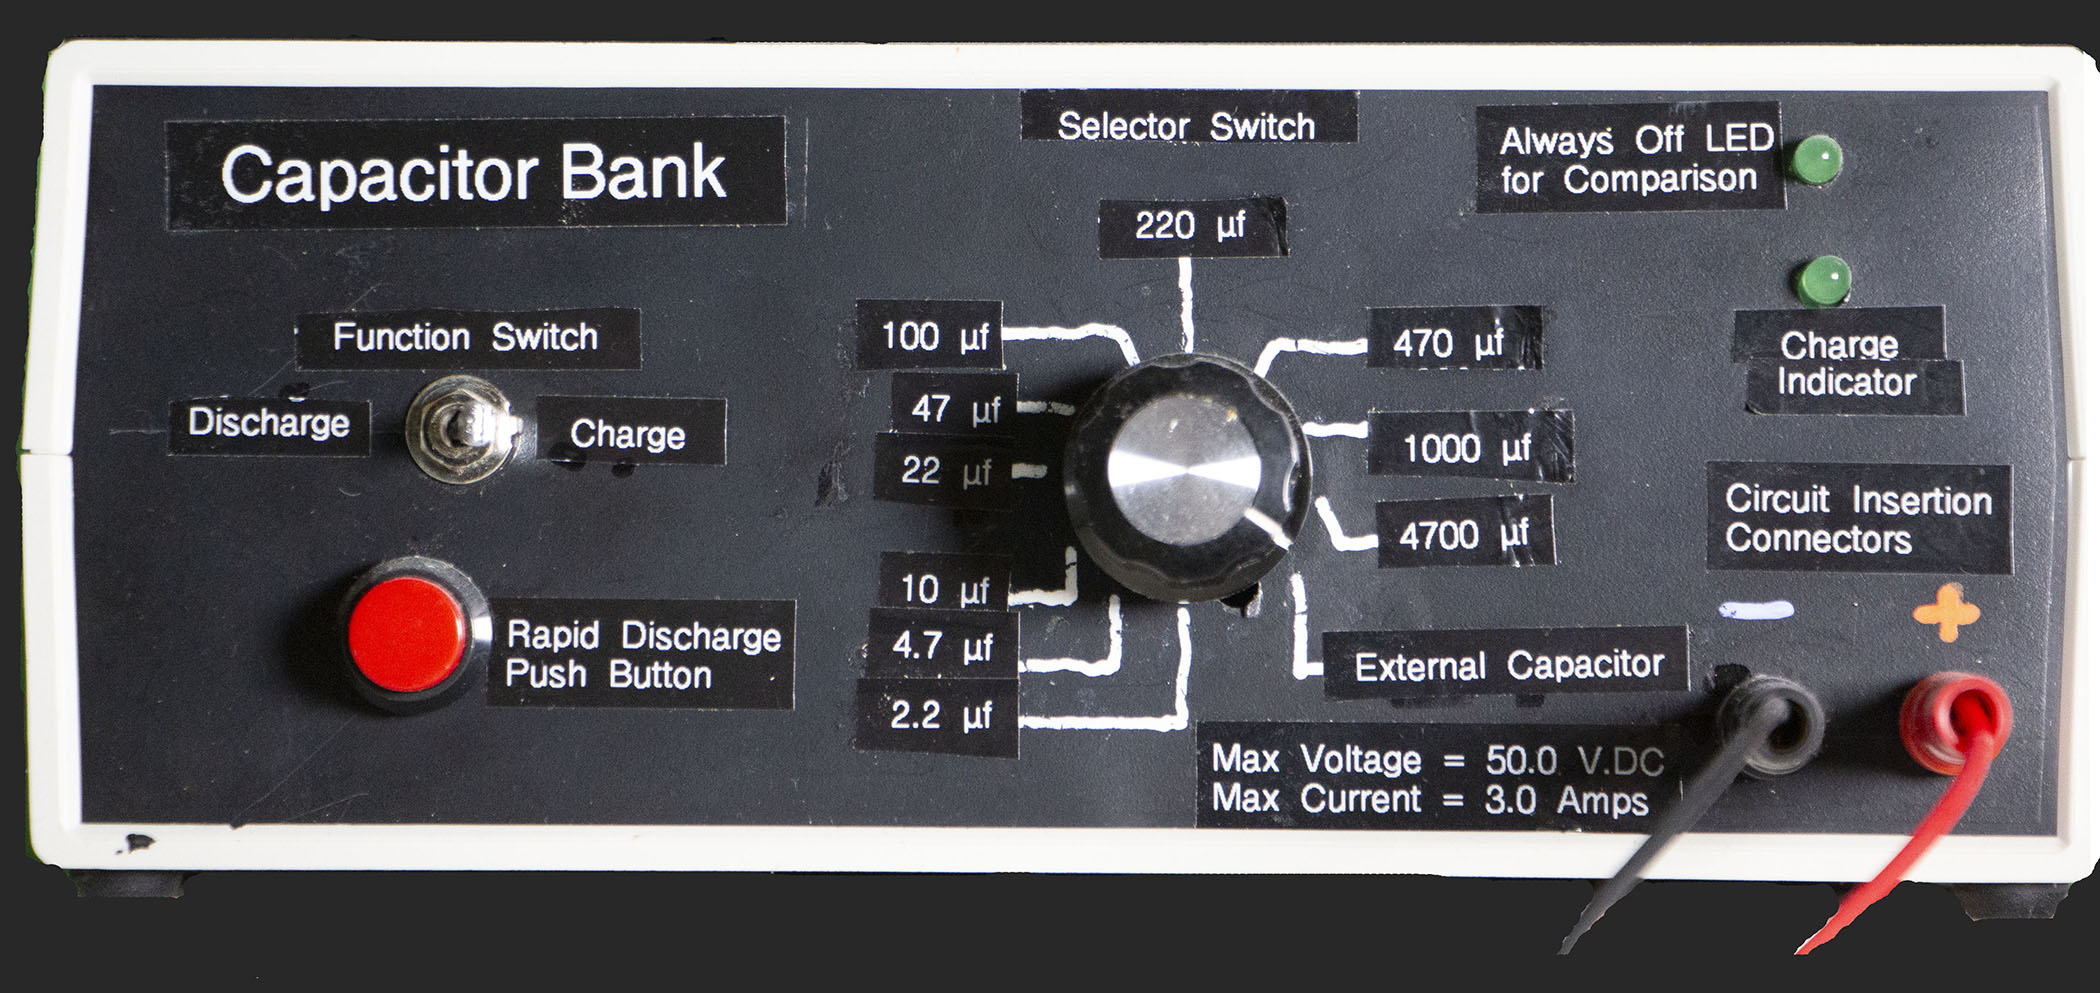
I built a Capacitor Box that would enable me to select any one of 10 internal capacitors, plus an external capasitor of any size. It includes a pair of green LEDs, one that is not connected to anything as a dark reference diode. The other is connected to the Positive terminal of the selected capacitor to indicate its state of charge. It also has a Charge/Discharge switch that charges the capacitor from an external power supply, and allows it to discharge through an external 10K ohm 5 Watt power resistor. I also added a Quick Discharge button with a 2.4K ohm 5 Watt Rapid Discharge Resistor that will effectively short the selected capacitor to ground only while the button is pressed. Finally, I used a set of banana jacks on the front panel to connect with the external Power Supply.
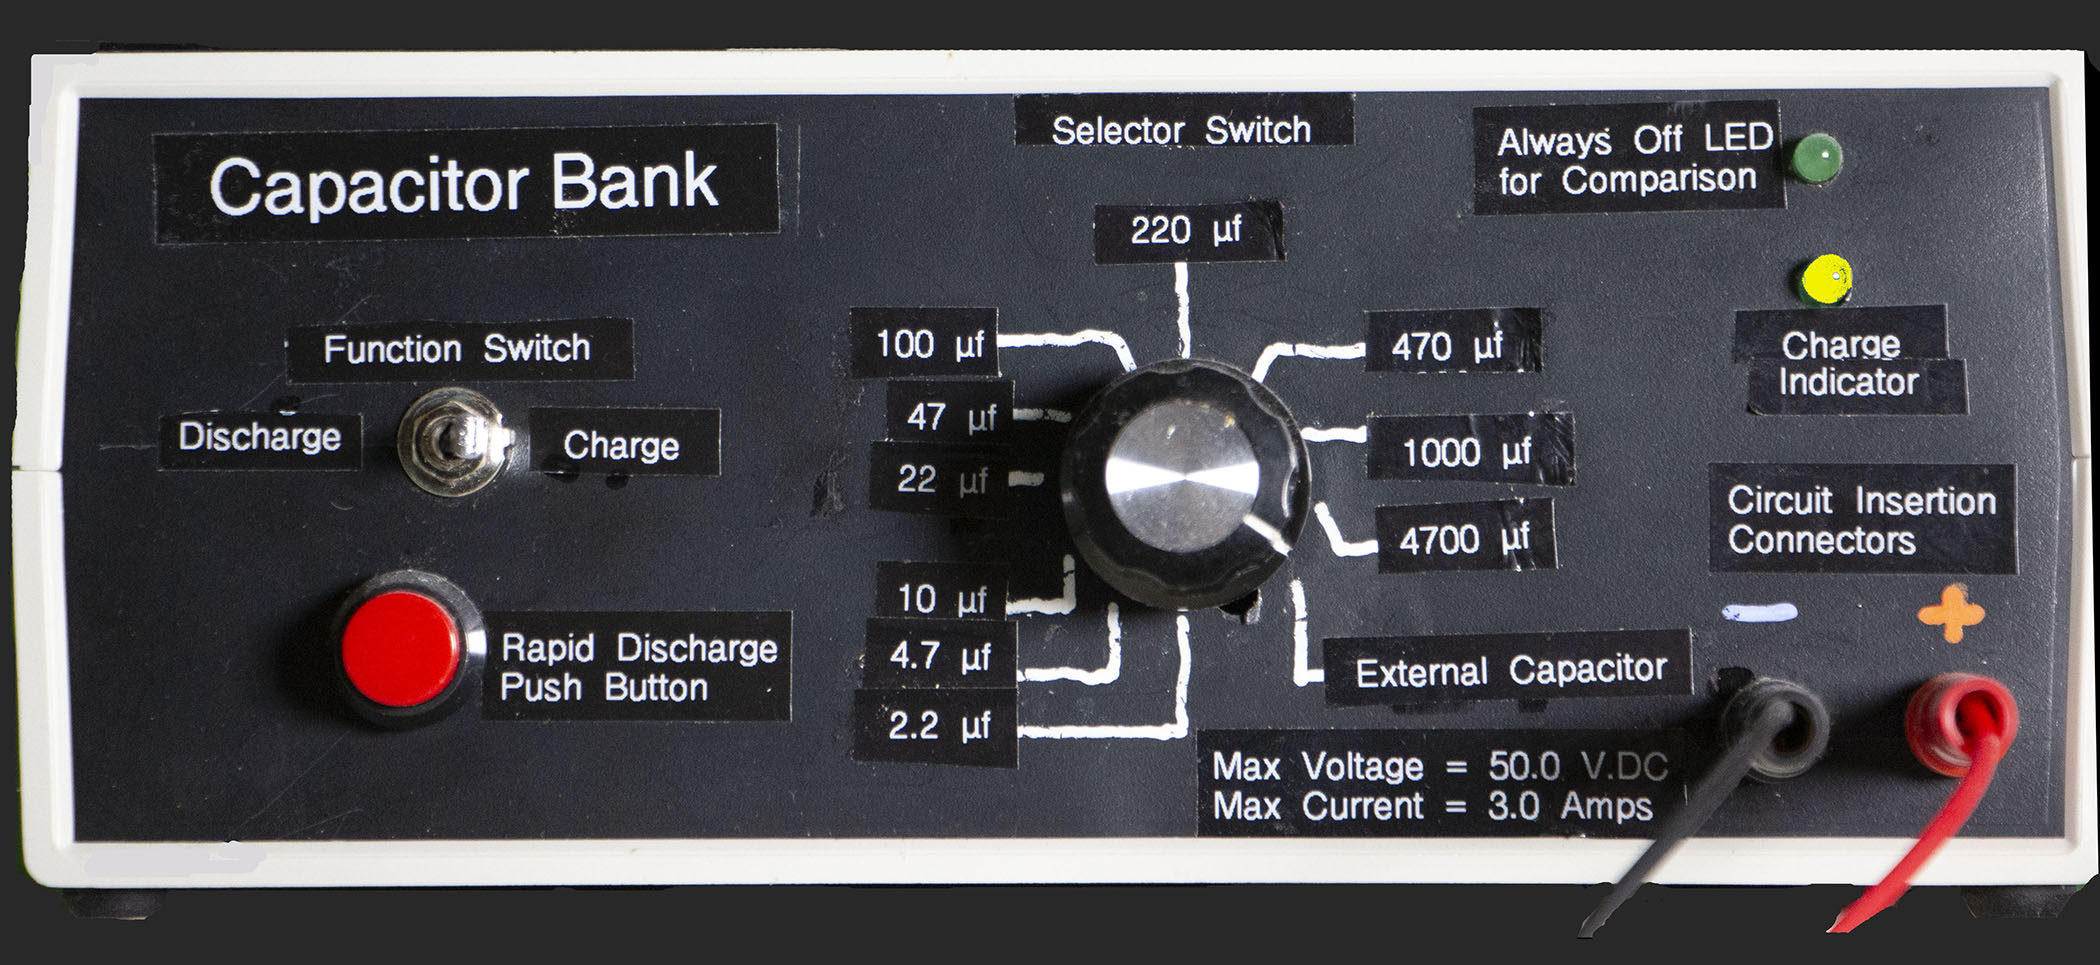
The indicator LED will dim as the selected capacitor discharges. Below is a pair of images of the front panel in which the first image shows the external capacitor
has been selected and is in a state of discharge. The second image shows the same panel when the same capacitor is in its charged state.
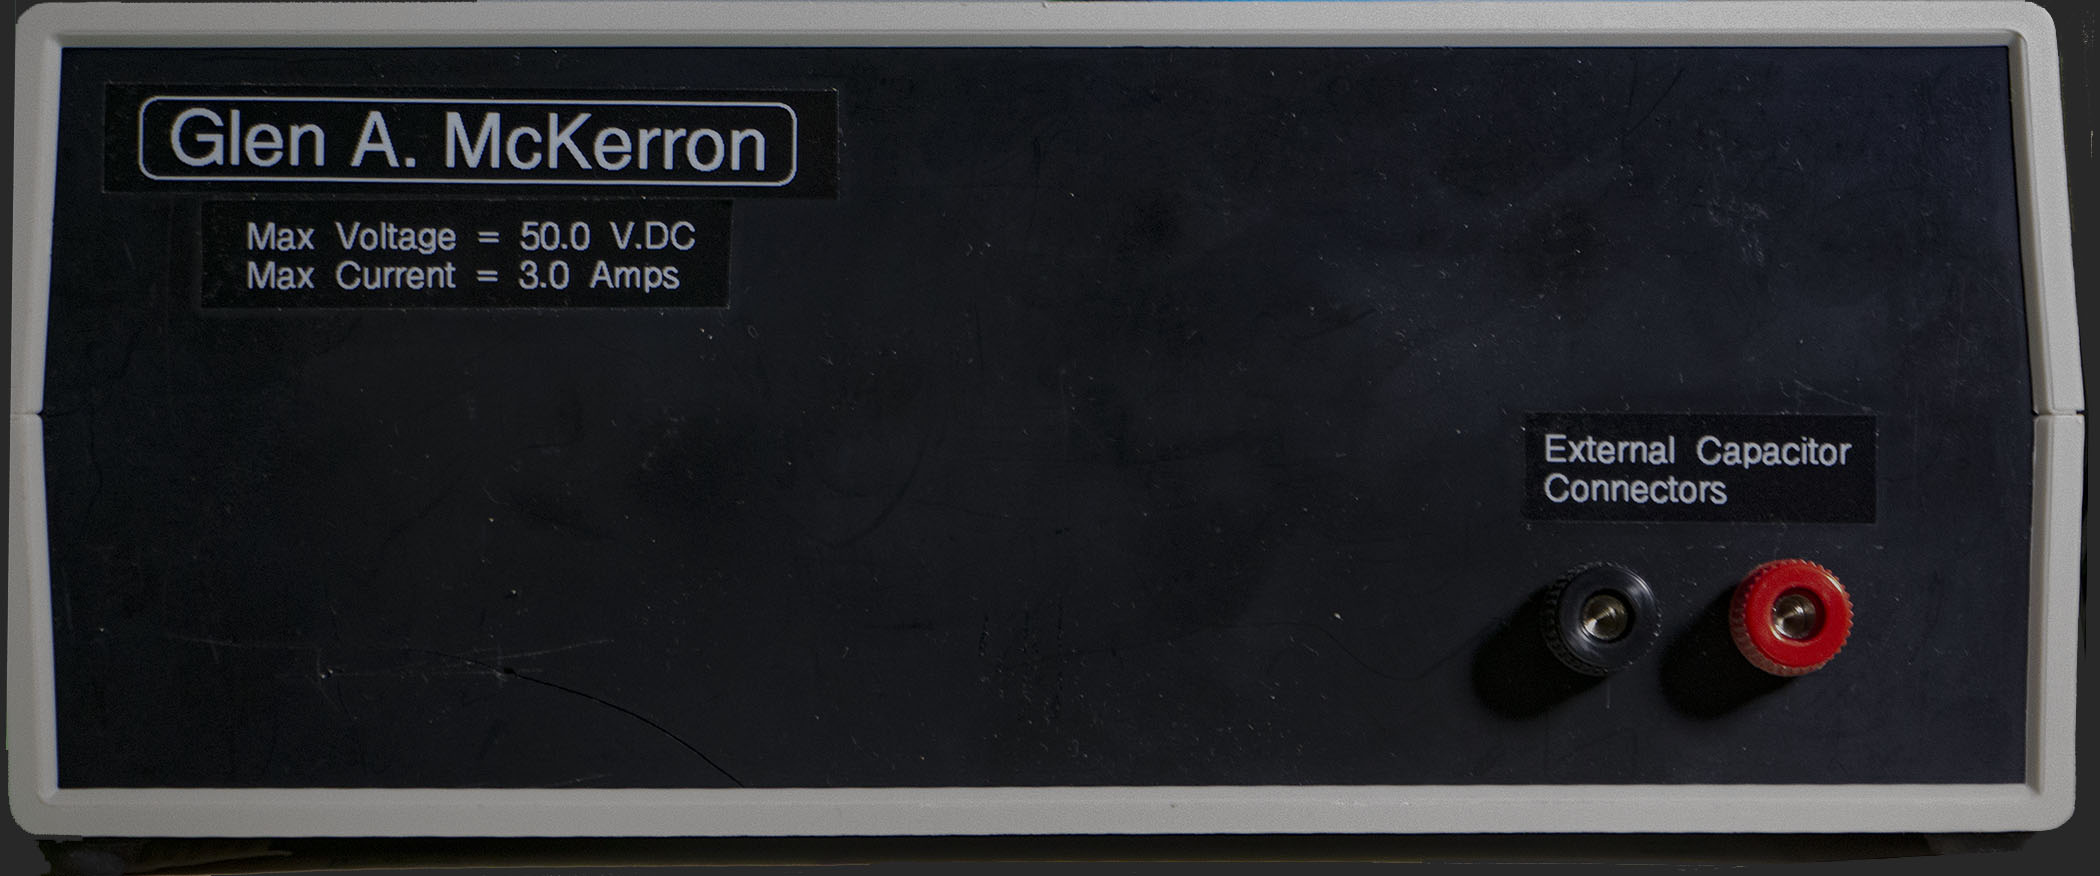
Following that is an image of the capacitor box's rear panel showing its pair of banana jacks that connect the external capacitor to the selector switch and the rest of the
box's circuitry.
Here is a view with the box's lid removed, and its rear panel partially removed: And yes, I propped the box up on a couple of SF novels which I enjoy reading, though unlike Arthur C. Clarke, Isaac Asimov, and Robert A. Heinlein, I have never tried my hand at writing an SF novel.
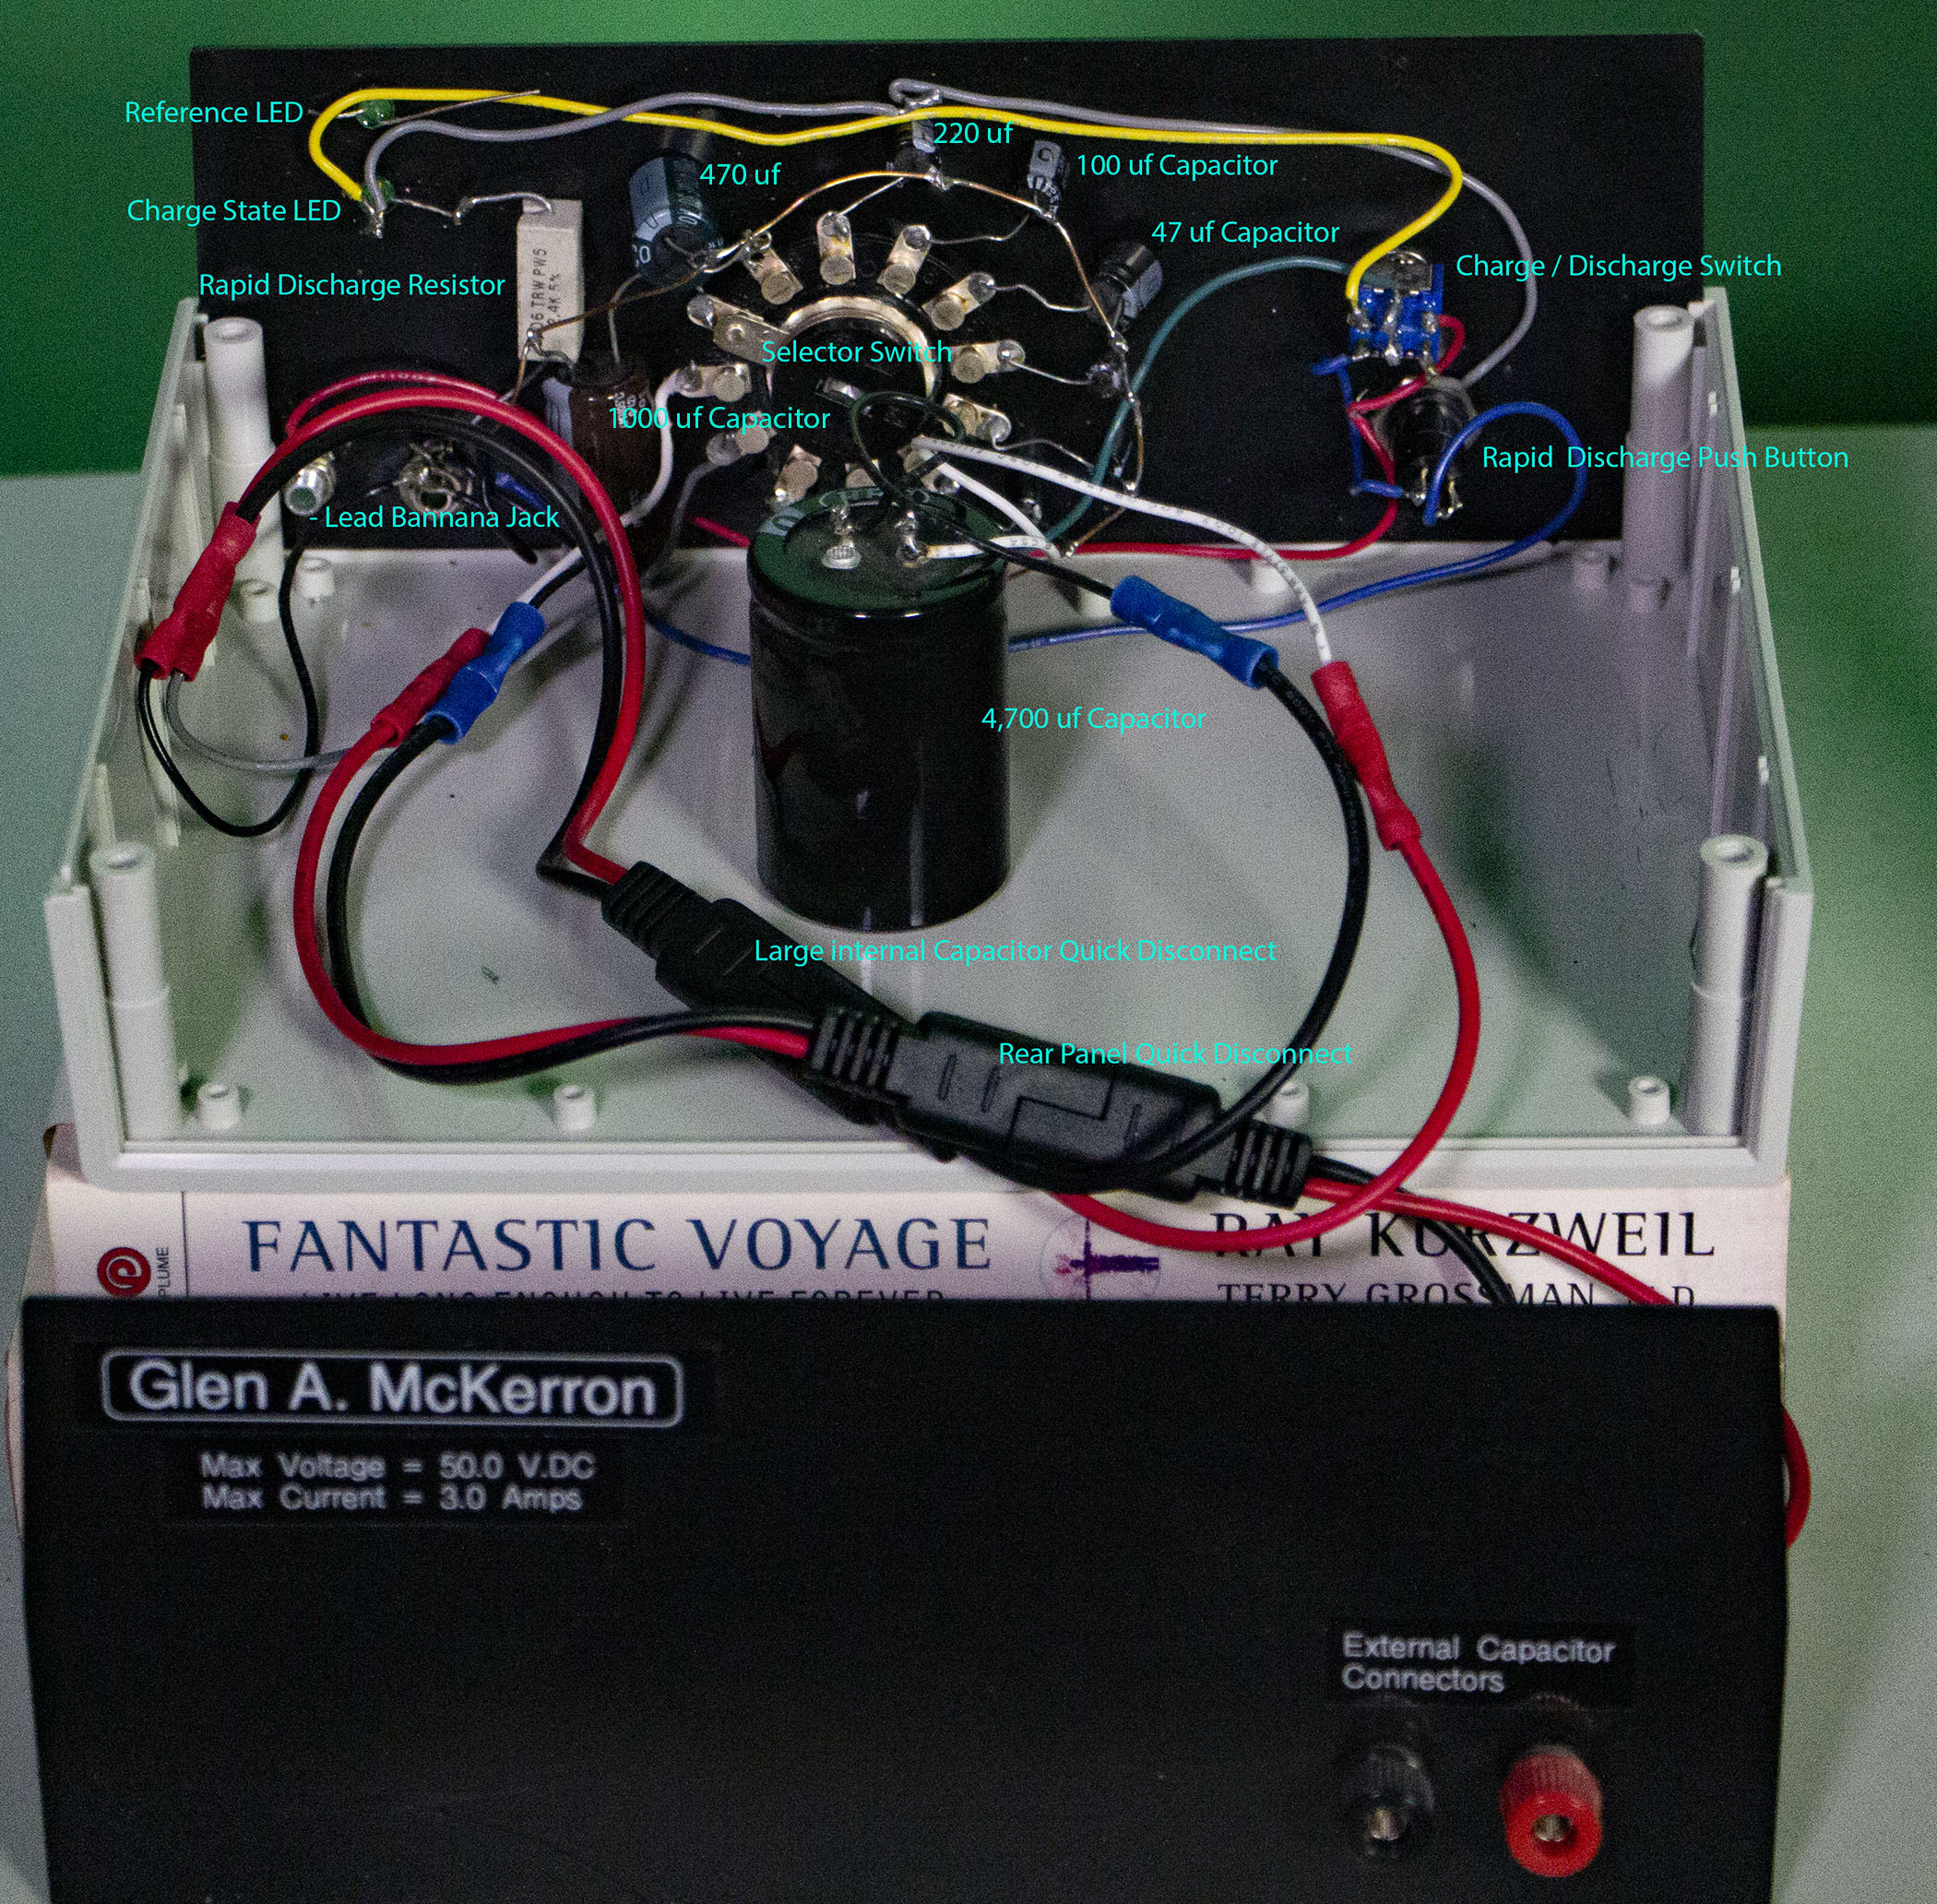
I have labelled all the clearly visible components. This leaves only the front panel Negative-Lead Banana Jack, and the first four small capacitors unlabelled.
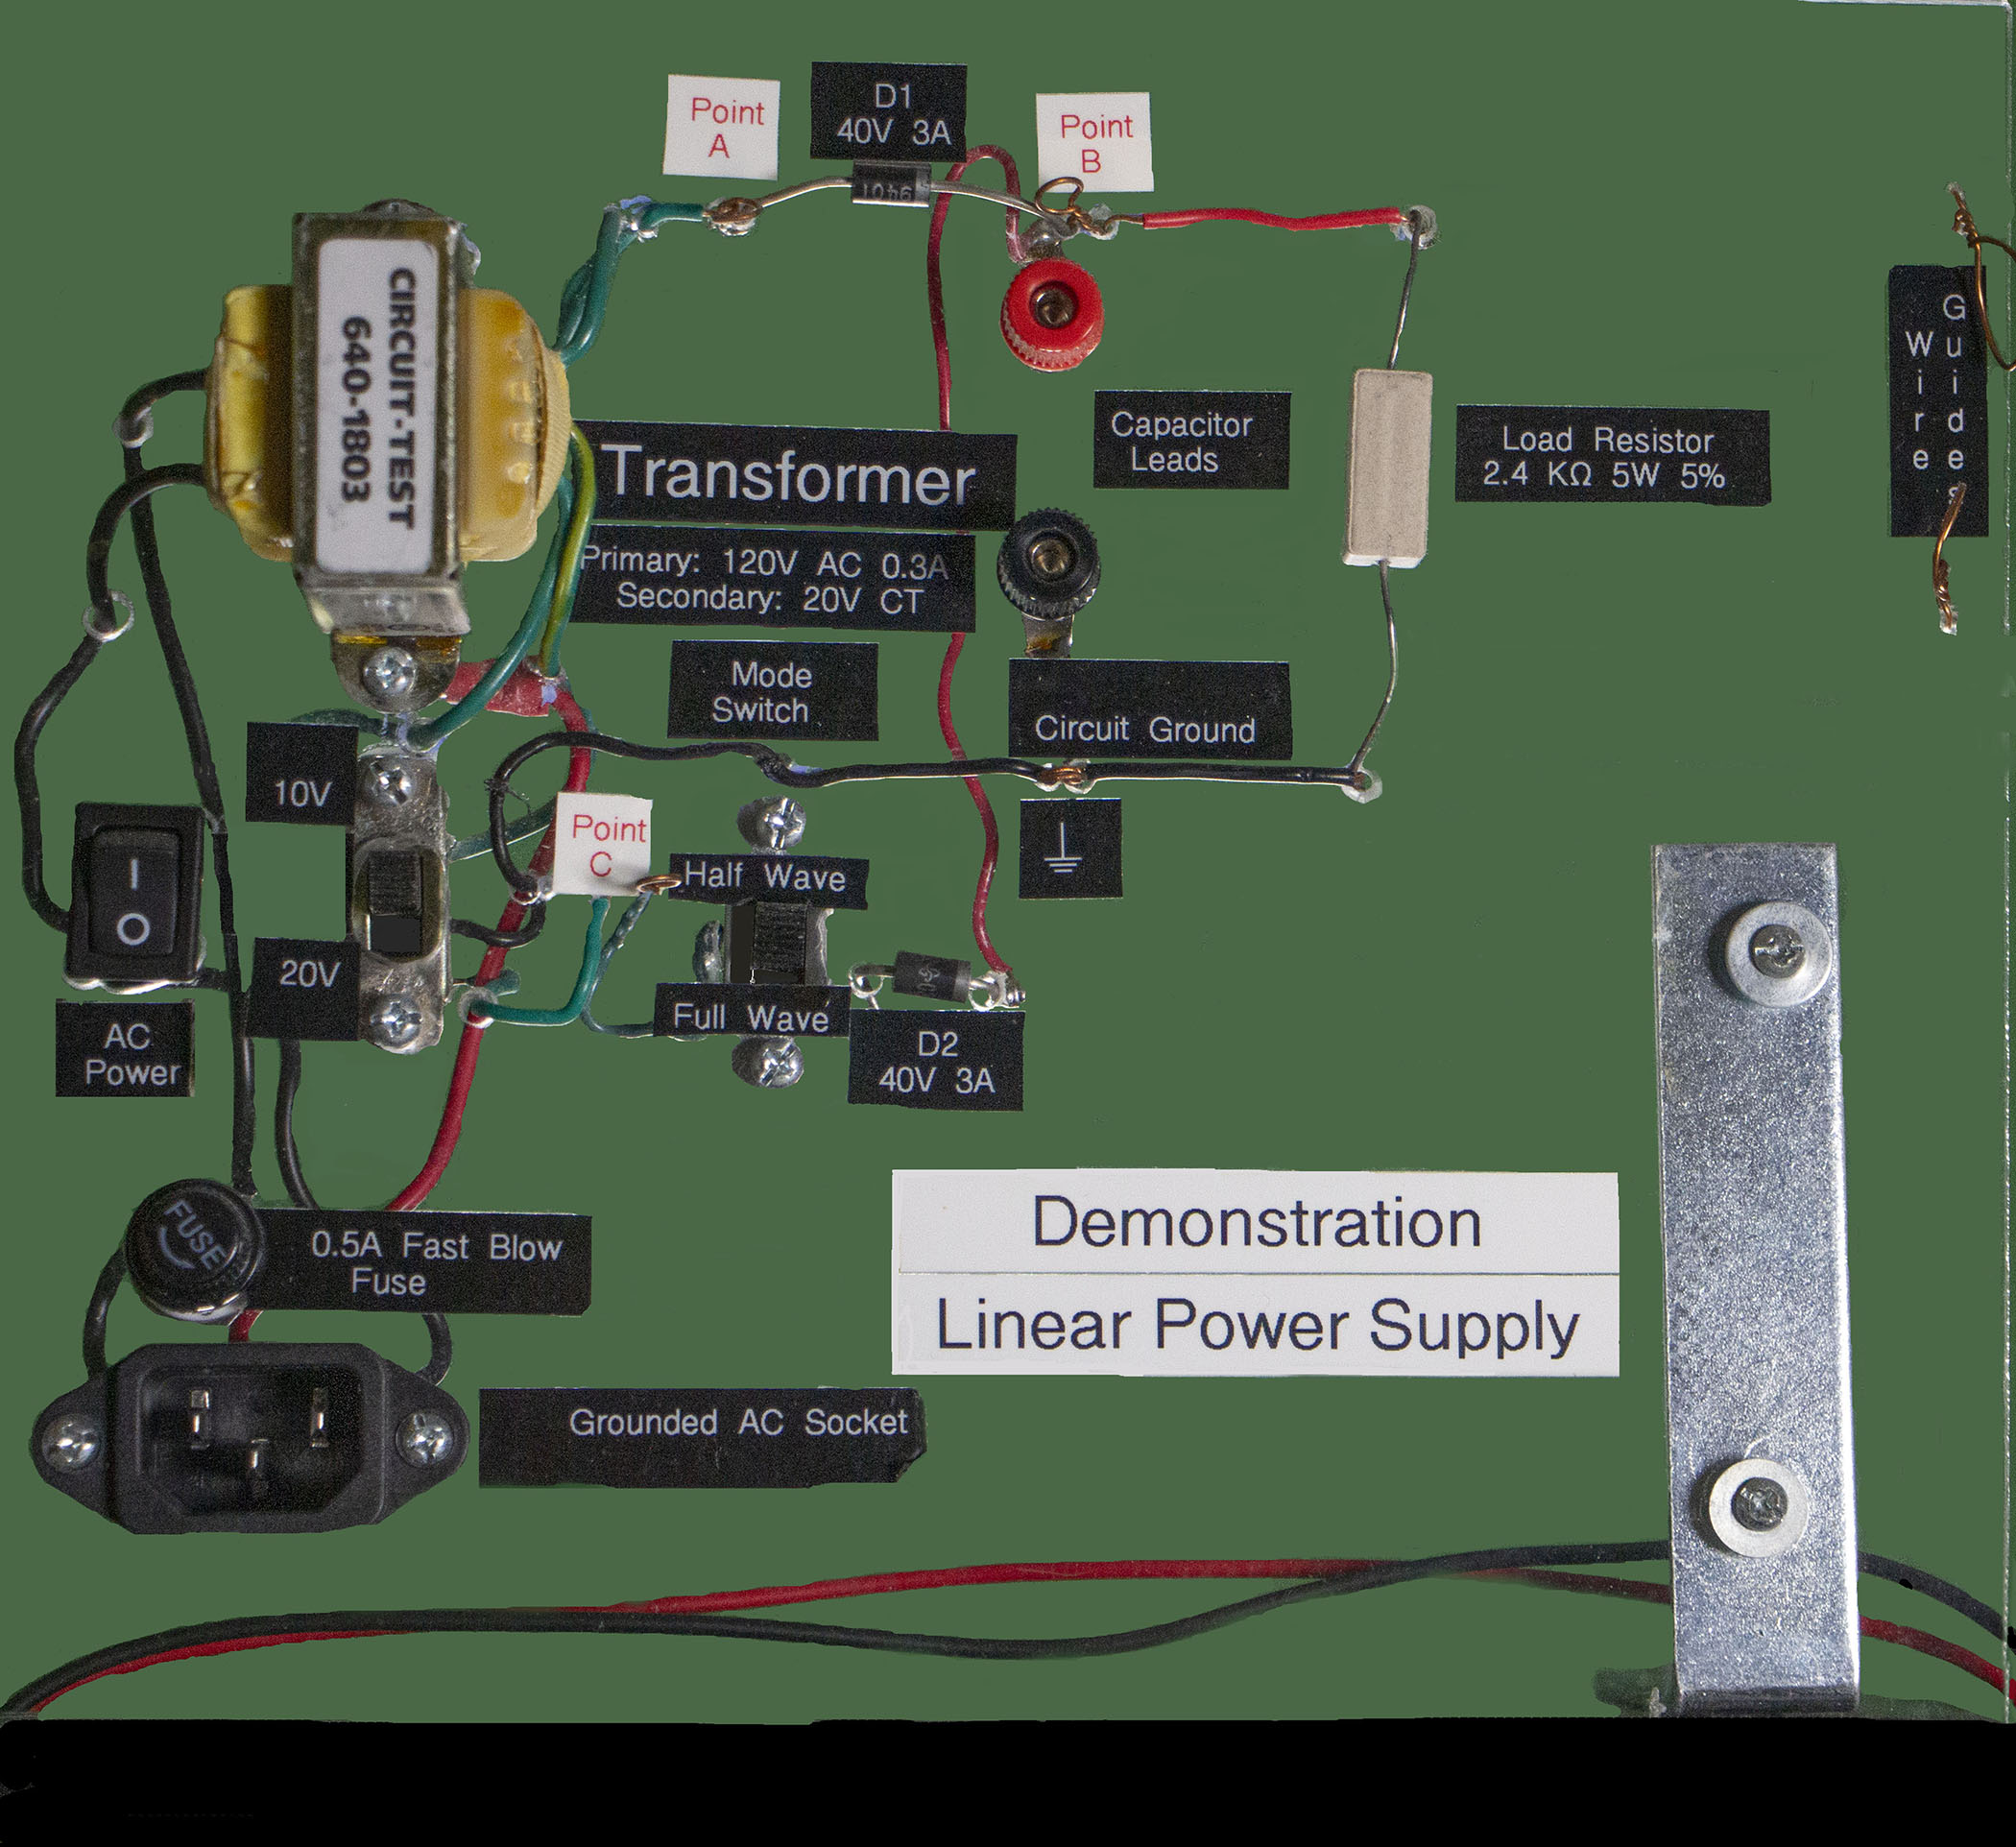
My second device was an unregulated linear Power Supply minus its filter capacitor,- mounted like a schematic diagram on a piece of plexiglass. By using a center tapped
Power Transformer and a second rectifier diode along with a two position switch, I am able to switch between full wave rectification and half wave rectification when 20 volt operation is selected by another two position
switch. I photographed it in front of my Green Screen making the components look like they were mounted on a green board. Please note some of the wires are on the back side of the plexiglass while some are on the front
side, and yet others pass through holes in the plexiglass from one side to the other,- sometimes more than once.
I have made numerous connection points using bare copper wire loops that pass through the plexiglass to important circuit junctions. These are meant for use with clip leads
from other instruments. I made similar but larger hoops to help guide the leads from other instruments to their proper locations. The Banana Jacks are for the connection to my Capacitor Box.
Below we see both devices working together to charge a 1,000 μf internal capacitor up to 10 volts. Here the large blue 62,000 μf external capacitor is not connected to the
capacitor box.

Here is a close up of my 100 MHz Triggered Sweep, Dual Trace, Storage type Oscilloscope. As shown it is turned on but neither channel has been selected.
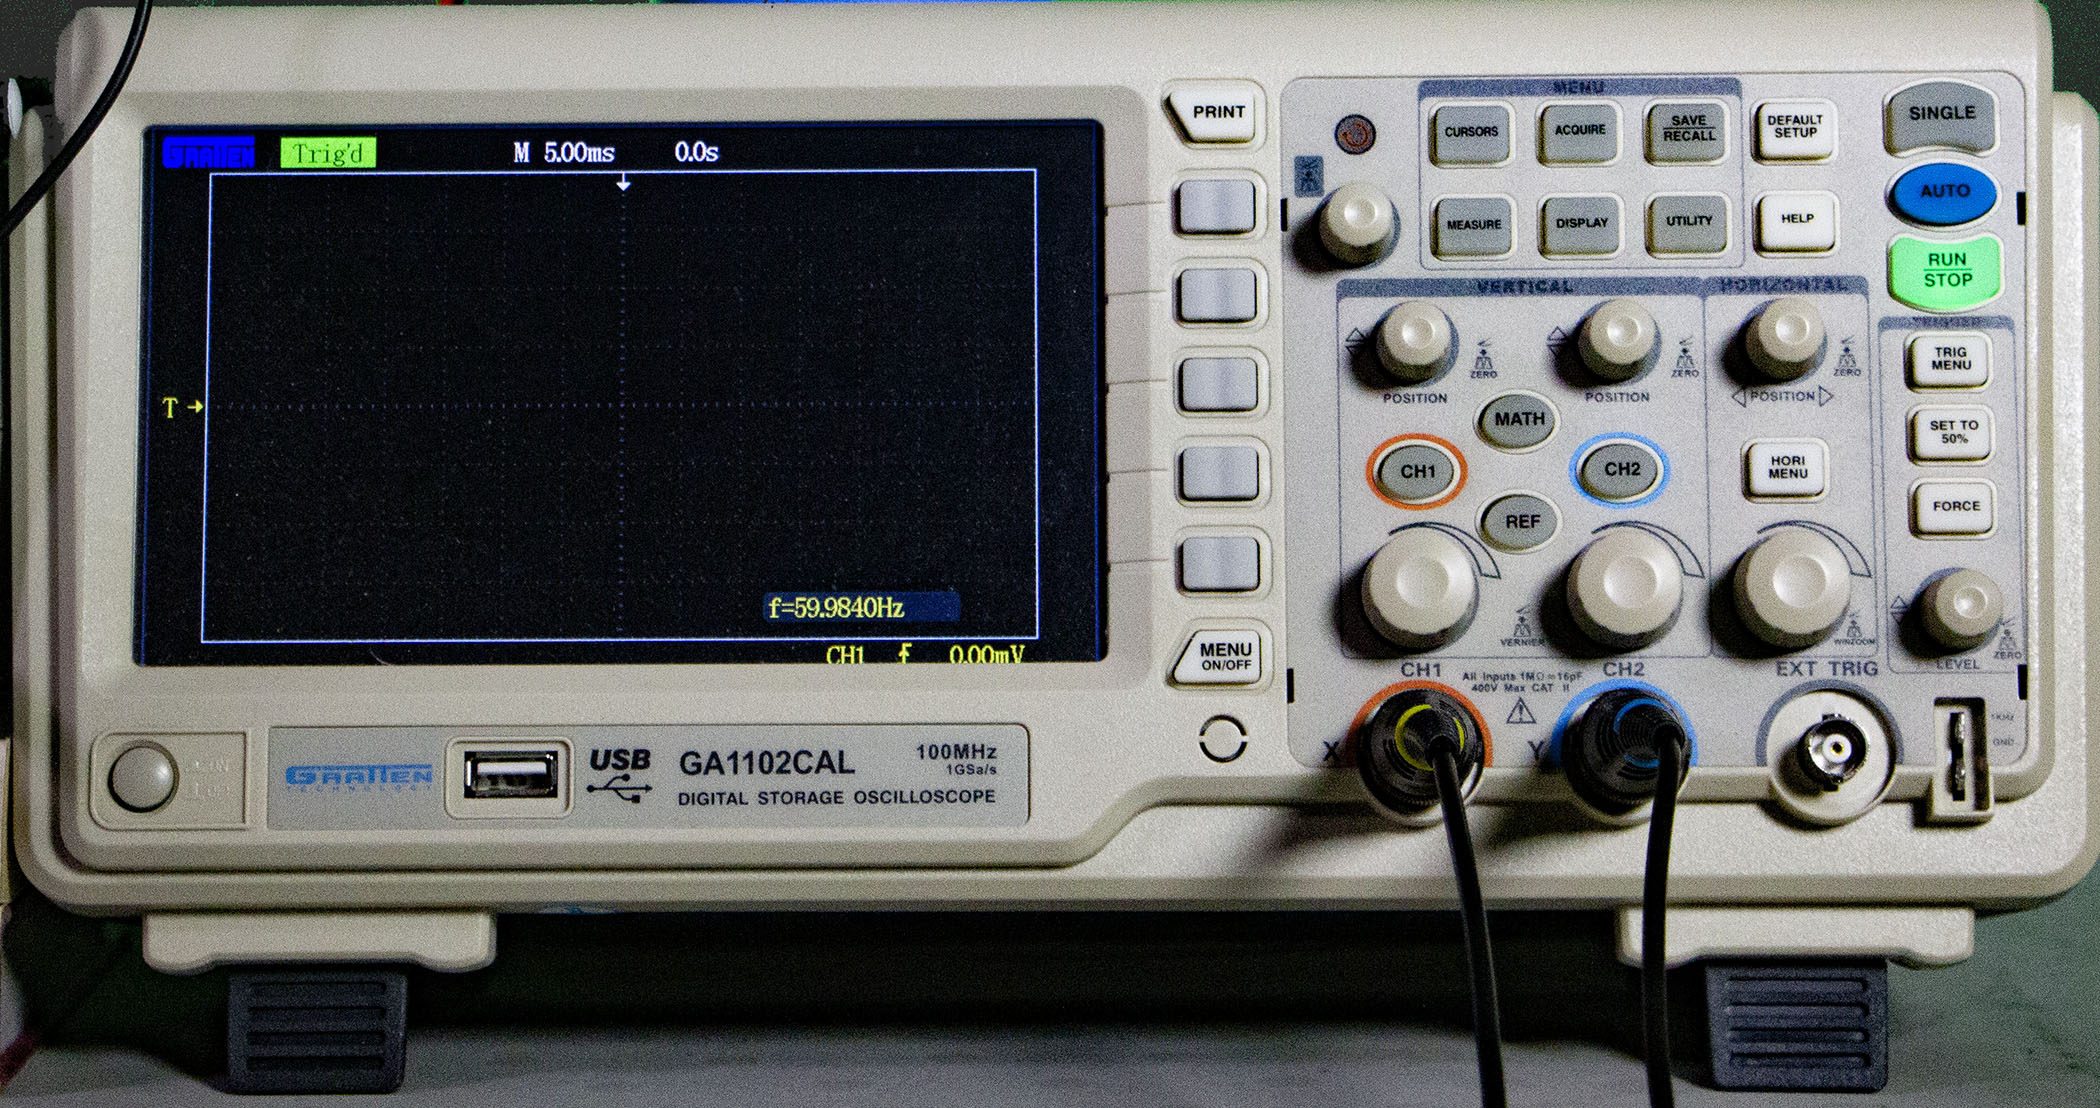
Here it is again with my previous two devices it works with. Both chanels have been turned on, but the test leads are not connected to the circuit.
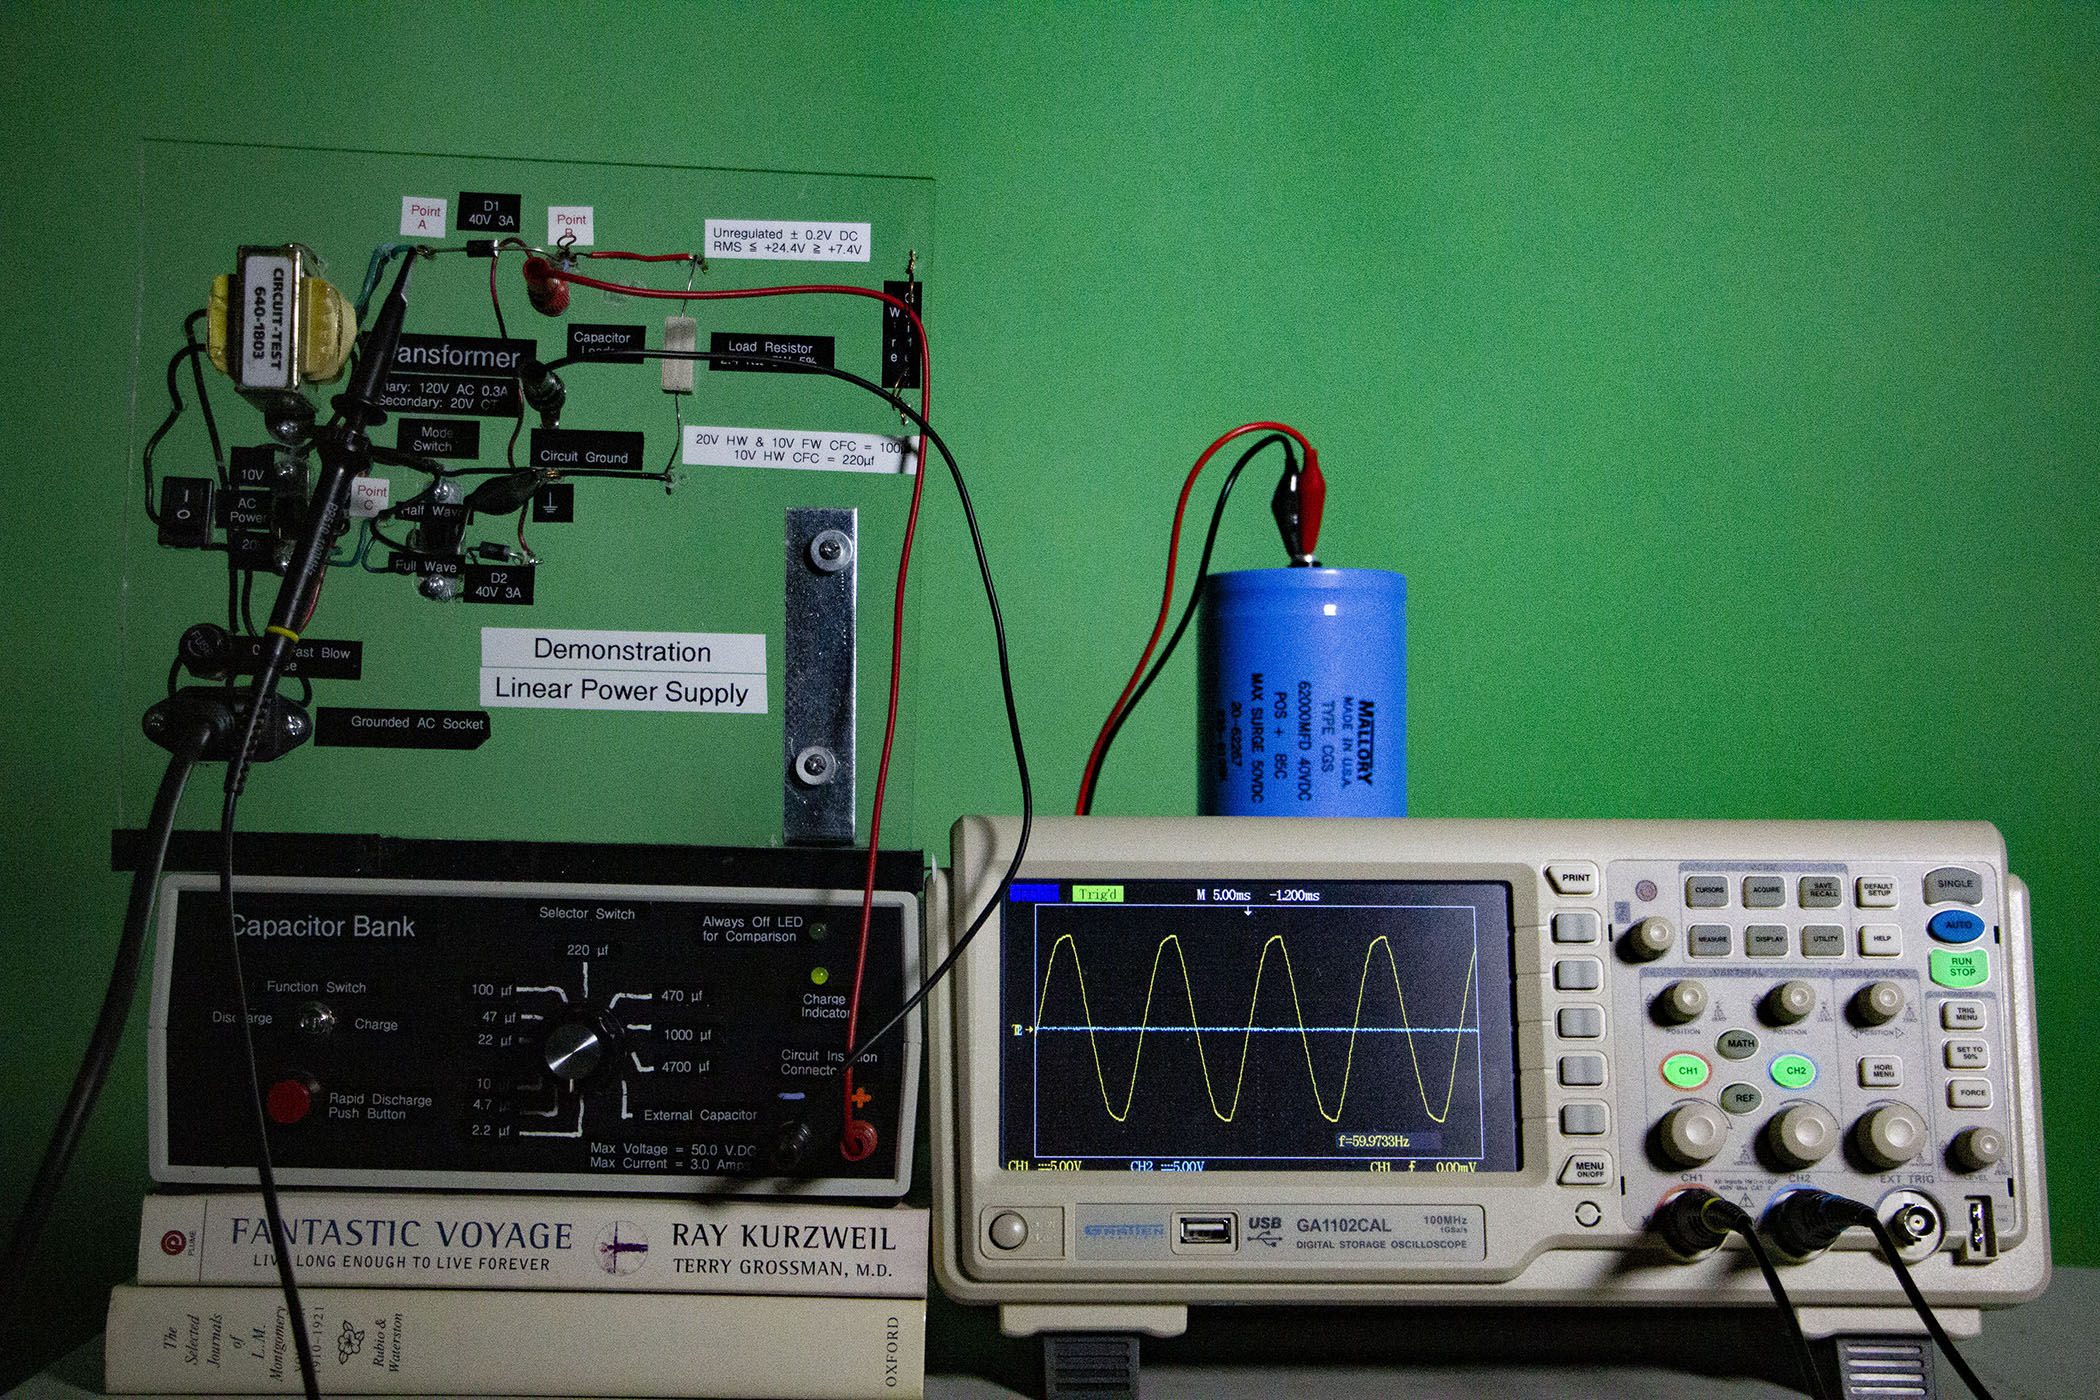
Below we see the Yellow test lead from channel 1 has been clipped to the input side of the rectifier diode, and the capacitor box is in its "discharge mode". On the
scope's display we also see the yellow trace of the 60 Hz Alternating Current from the power transformer. The scope's Horizontal synch has been adjusted to display a little more than 4 complete cycles, the
trigger is set on the positive slope of channel 1's trace, and the horizontal position adjusted to begin the trace at the left hand edge of the screen.
Here is a close-up of the scope's screen from the above set-up. Later I shall reuse this trace to show how Solar cycles on Earth produce the same sine wave on a
different time scale.
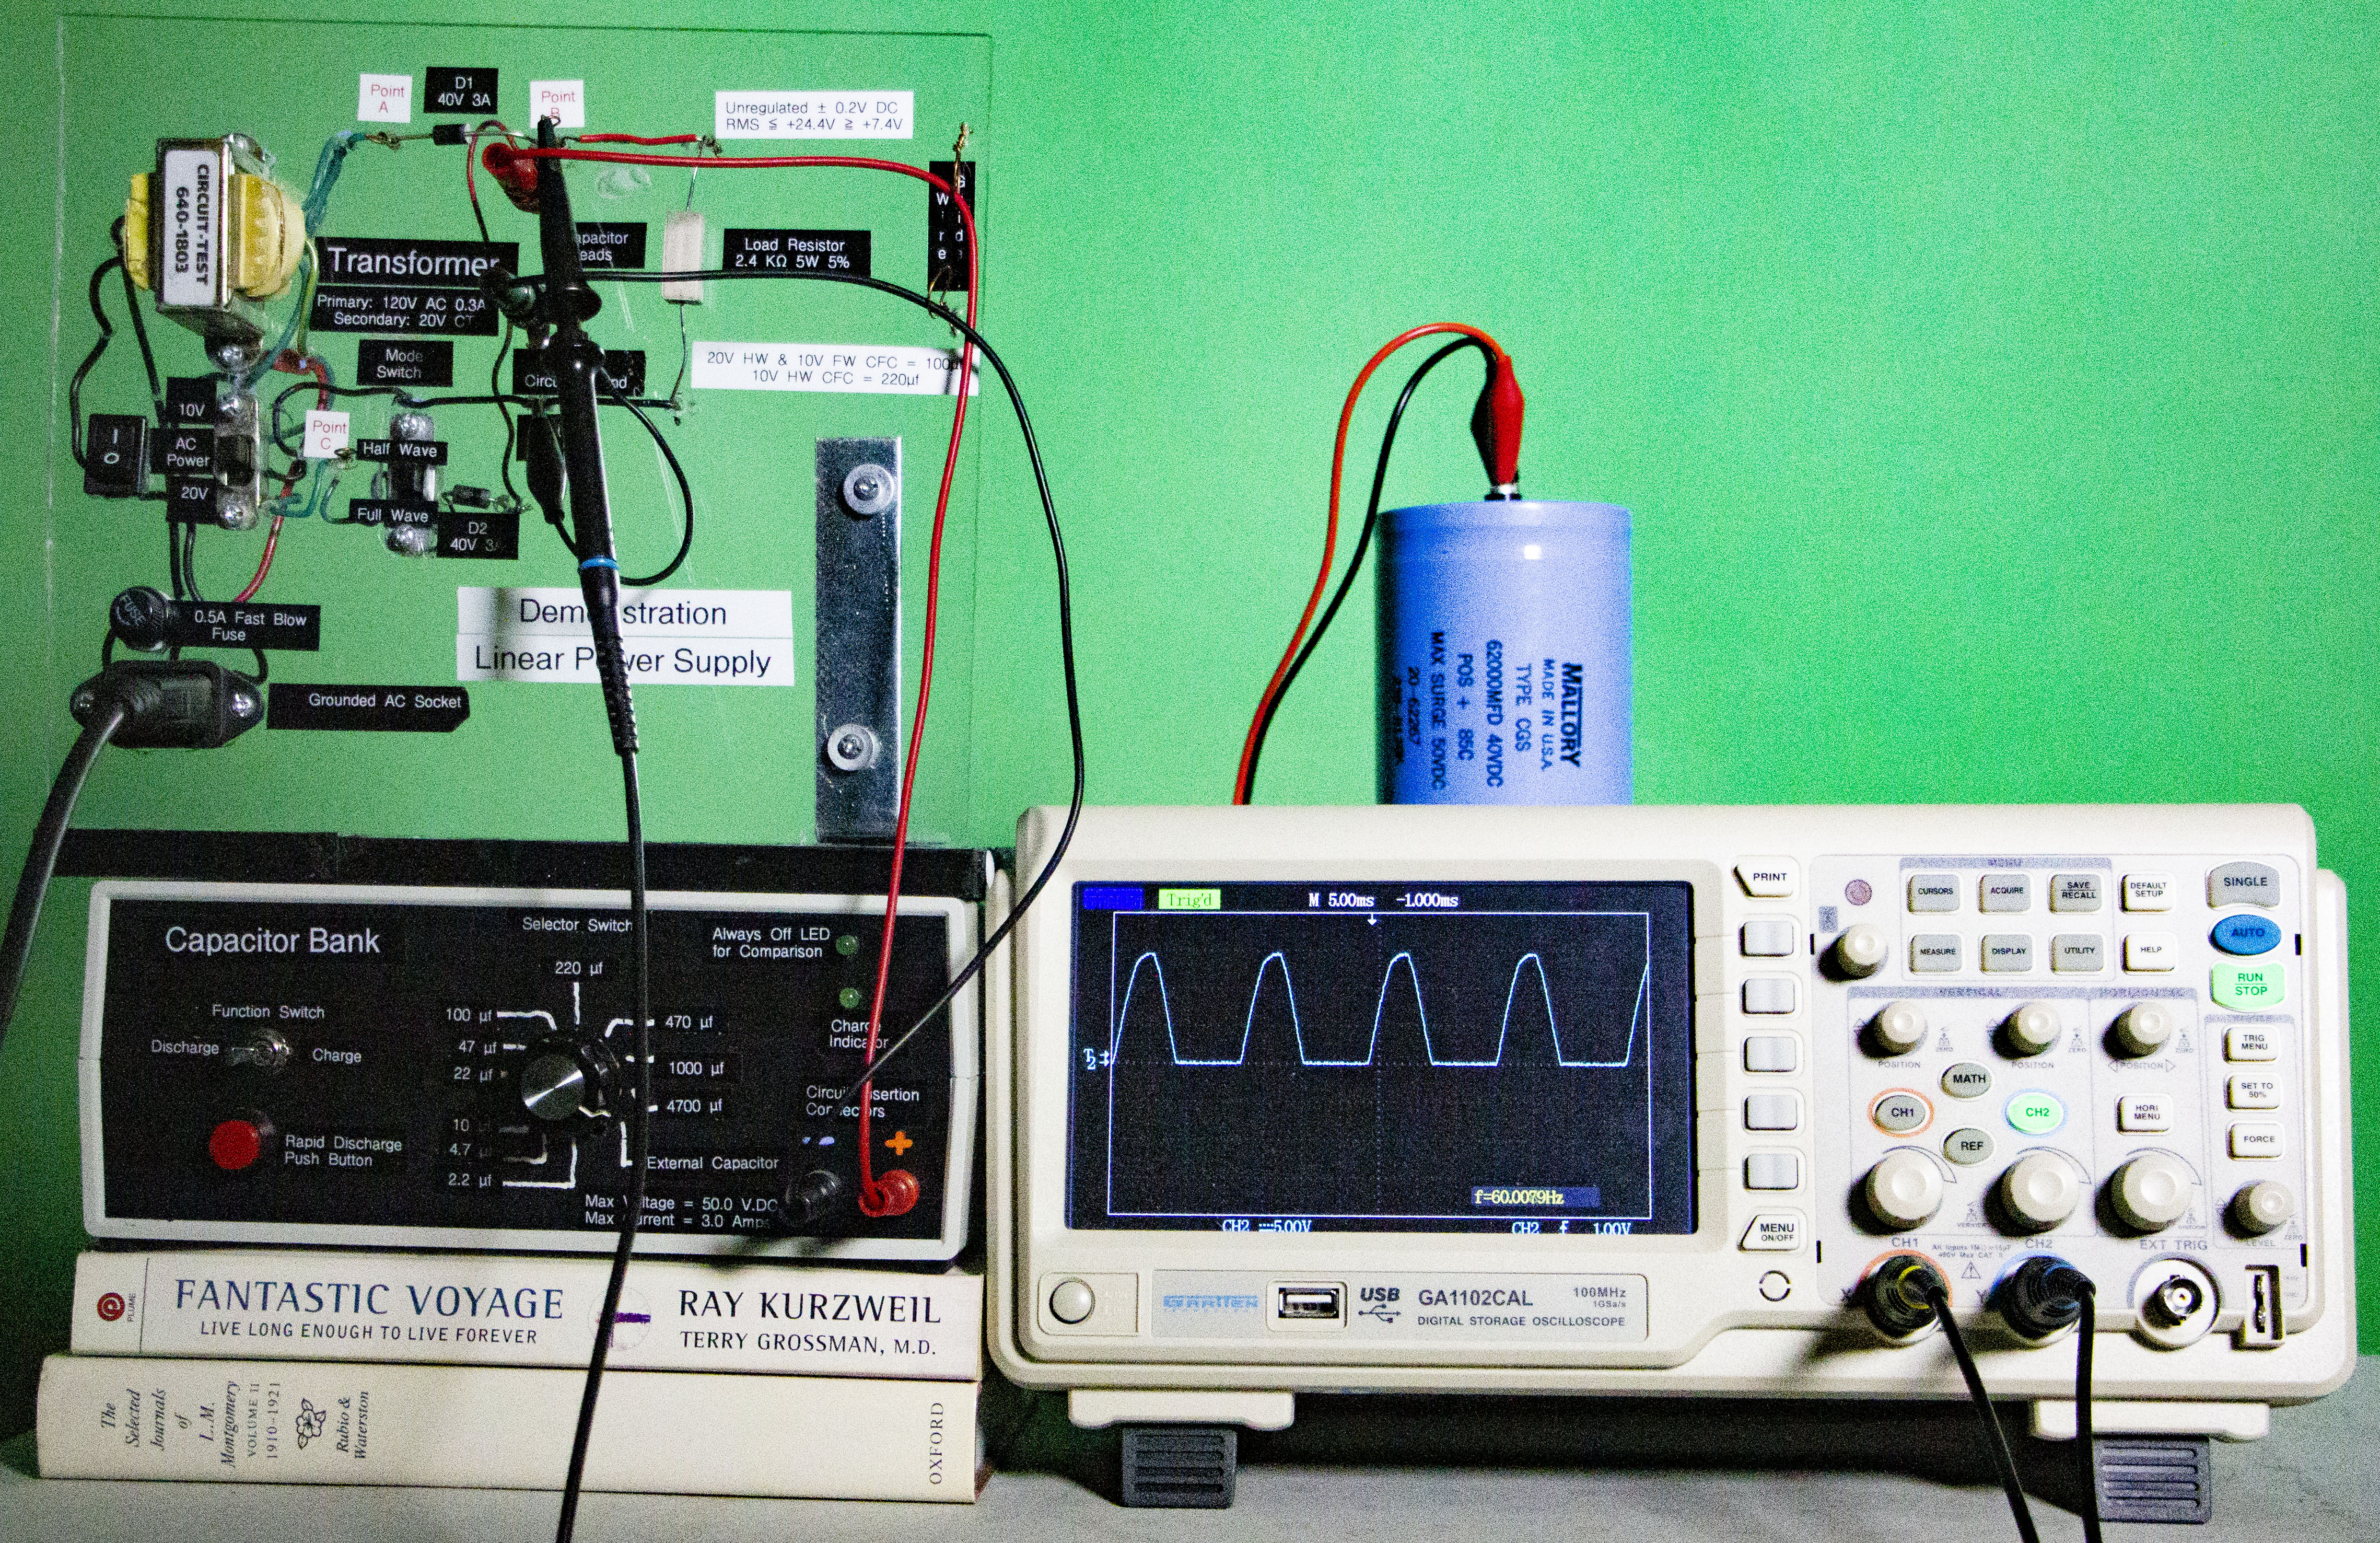
Next we see how the Blue test lead from channel 2 has been clipped to the output side of the same rectifier diode, with the capacitor box still in its discharge mode.
Here no changes have been made to the scope's settings except that the scope's channel 1 has been switched off. and the trigger is set on the positive slope of channel 2's trace. the blue trace shows how the input sine wave has been "half wave rectified" so that only the positive lobes
of the input sine wave have been allowed to flow through the diode. A photovoltaic solar cell in a clearing in the jungle at the equator during good weather would produce a similar trace on a chart recorder.
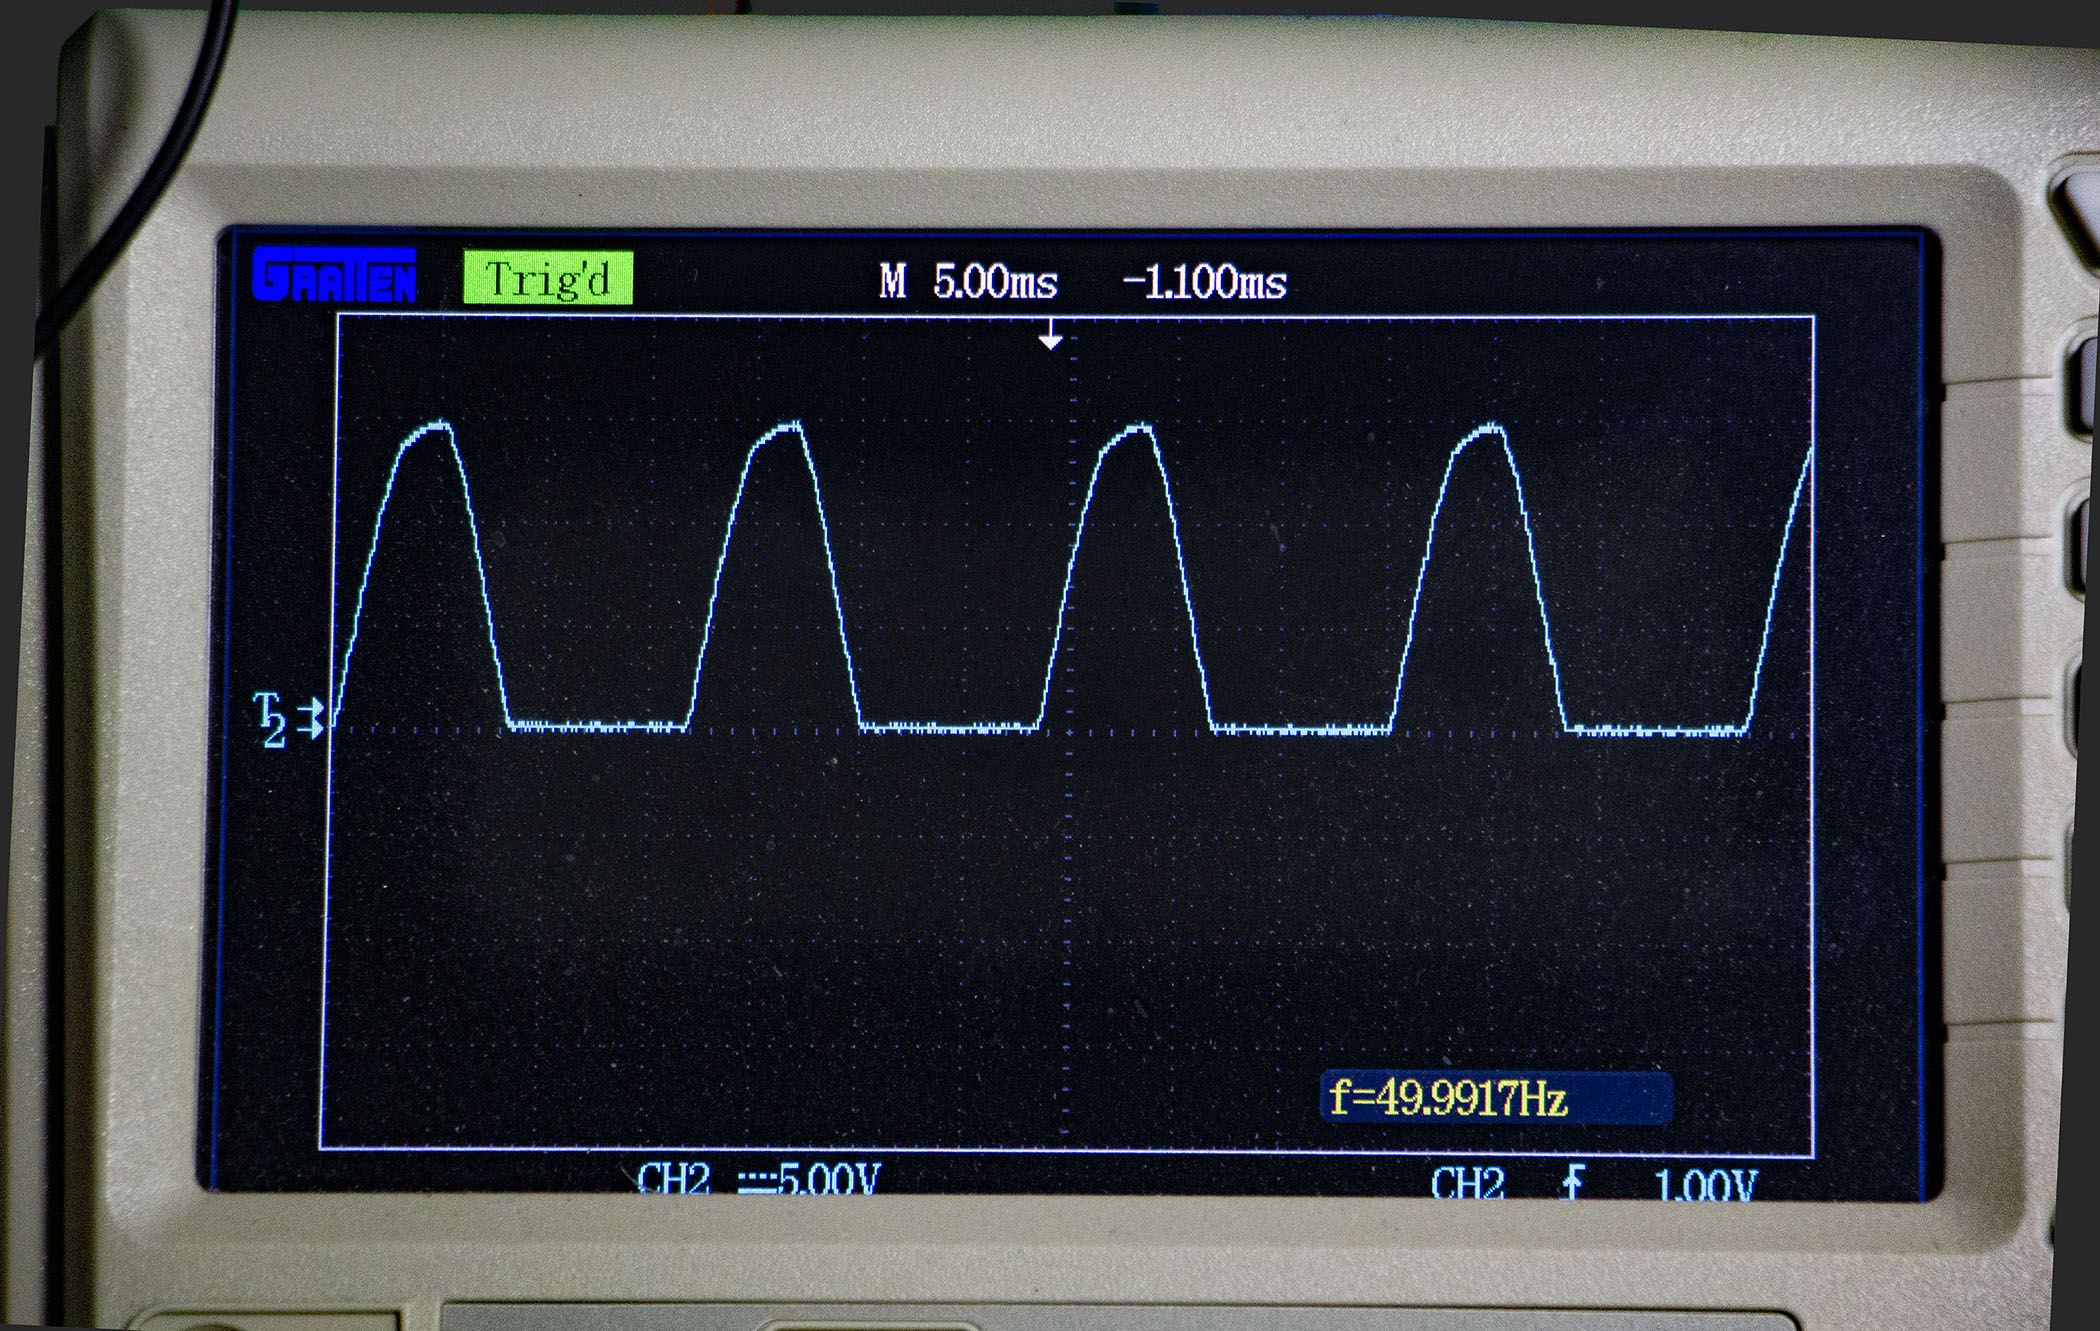
Here is a close up of the scope's blue trace. We use photo cells to automatically switch our street lights on and off, but additional circuitry is required to set the levels
of light used to operate the switch,- in order to compensate for the twilight zone above and below the set point.
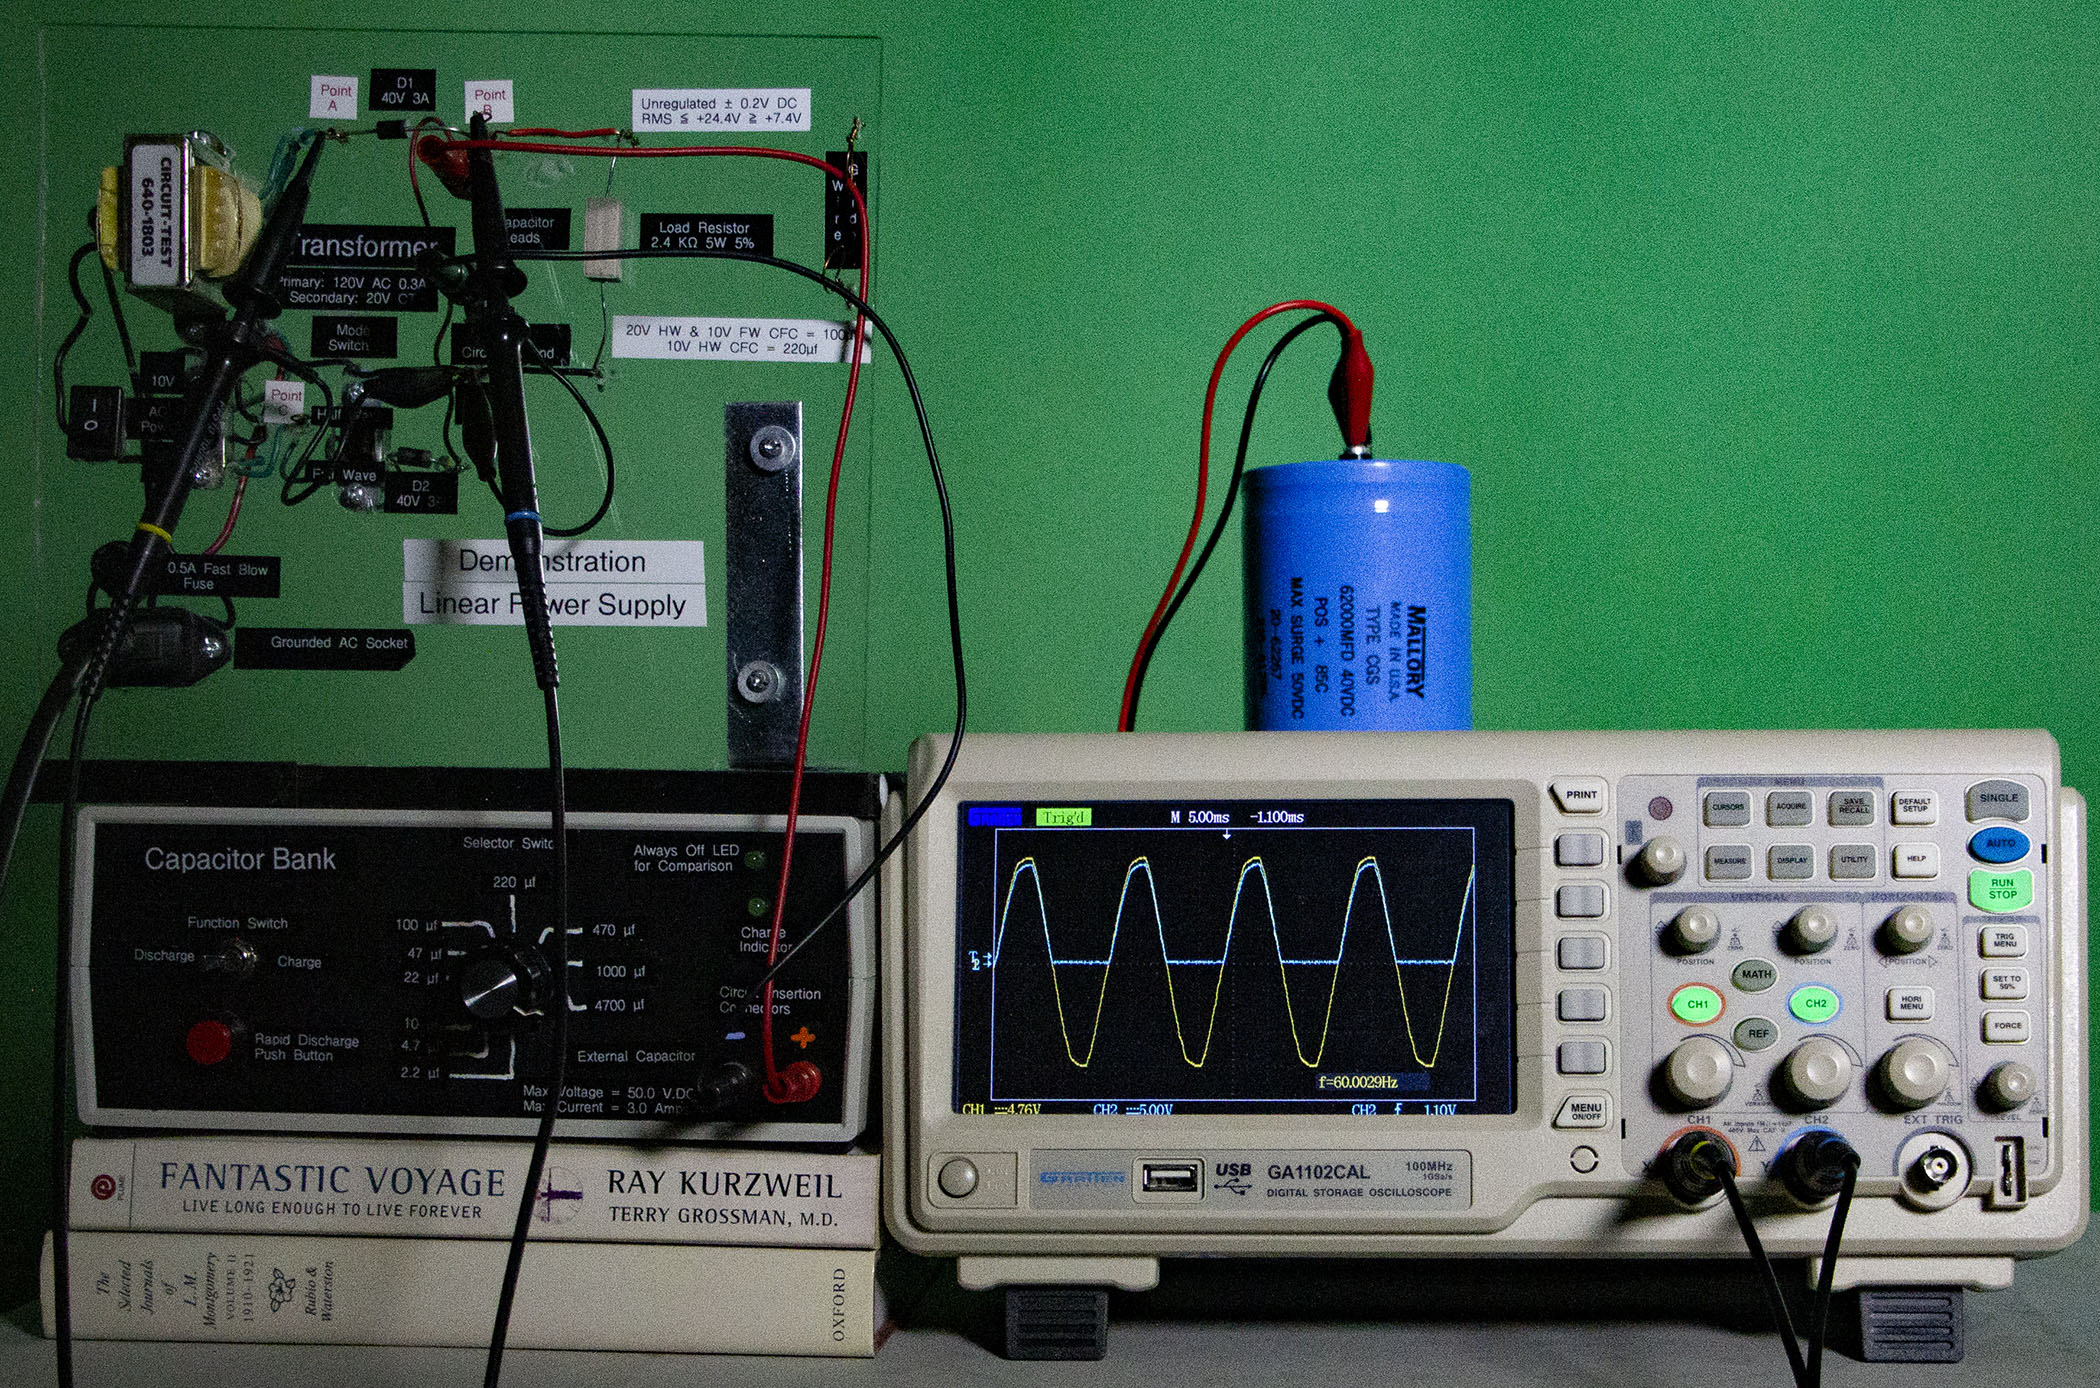
The nice thing about multiple trace oscilloscopes is that you can view all the traces at once on the same screen as seen below. Note that in only allowing the
positive lobes of the sine wave to pass through, the diode cuts out all of the sine wave's negative lobes.
With the following close up of both traces we can observe the voltage drop across the rectifier diode where the blue peaks do not climb as high as the yellow peaks do. Now we
can use this set-up to simulate the spin of the Earth away from the Sun during the nightime without resorting to the sophisticated computer programs of the Pro-Gore Biased programmers at the UNIPCC.
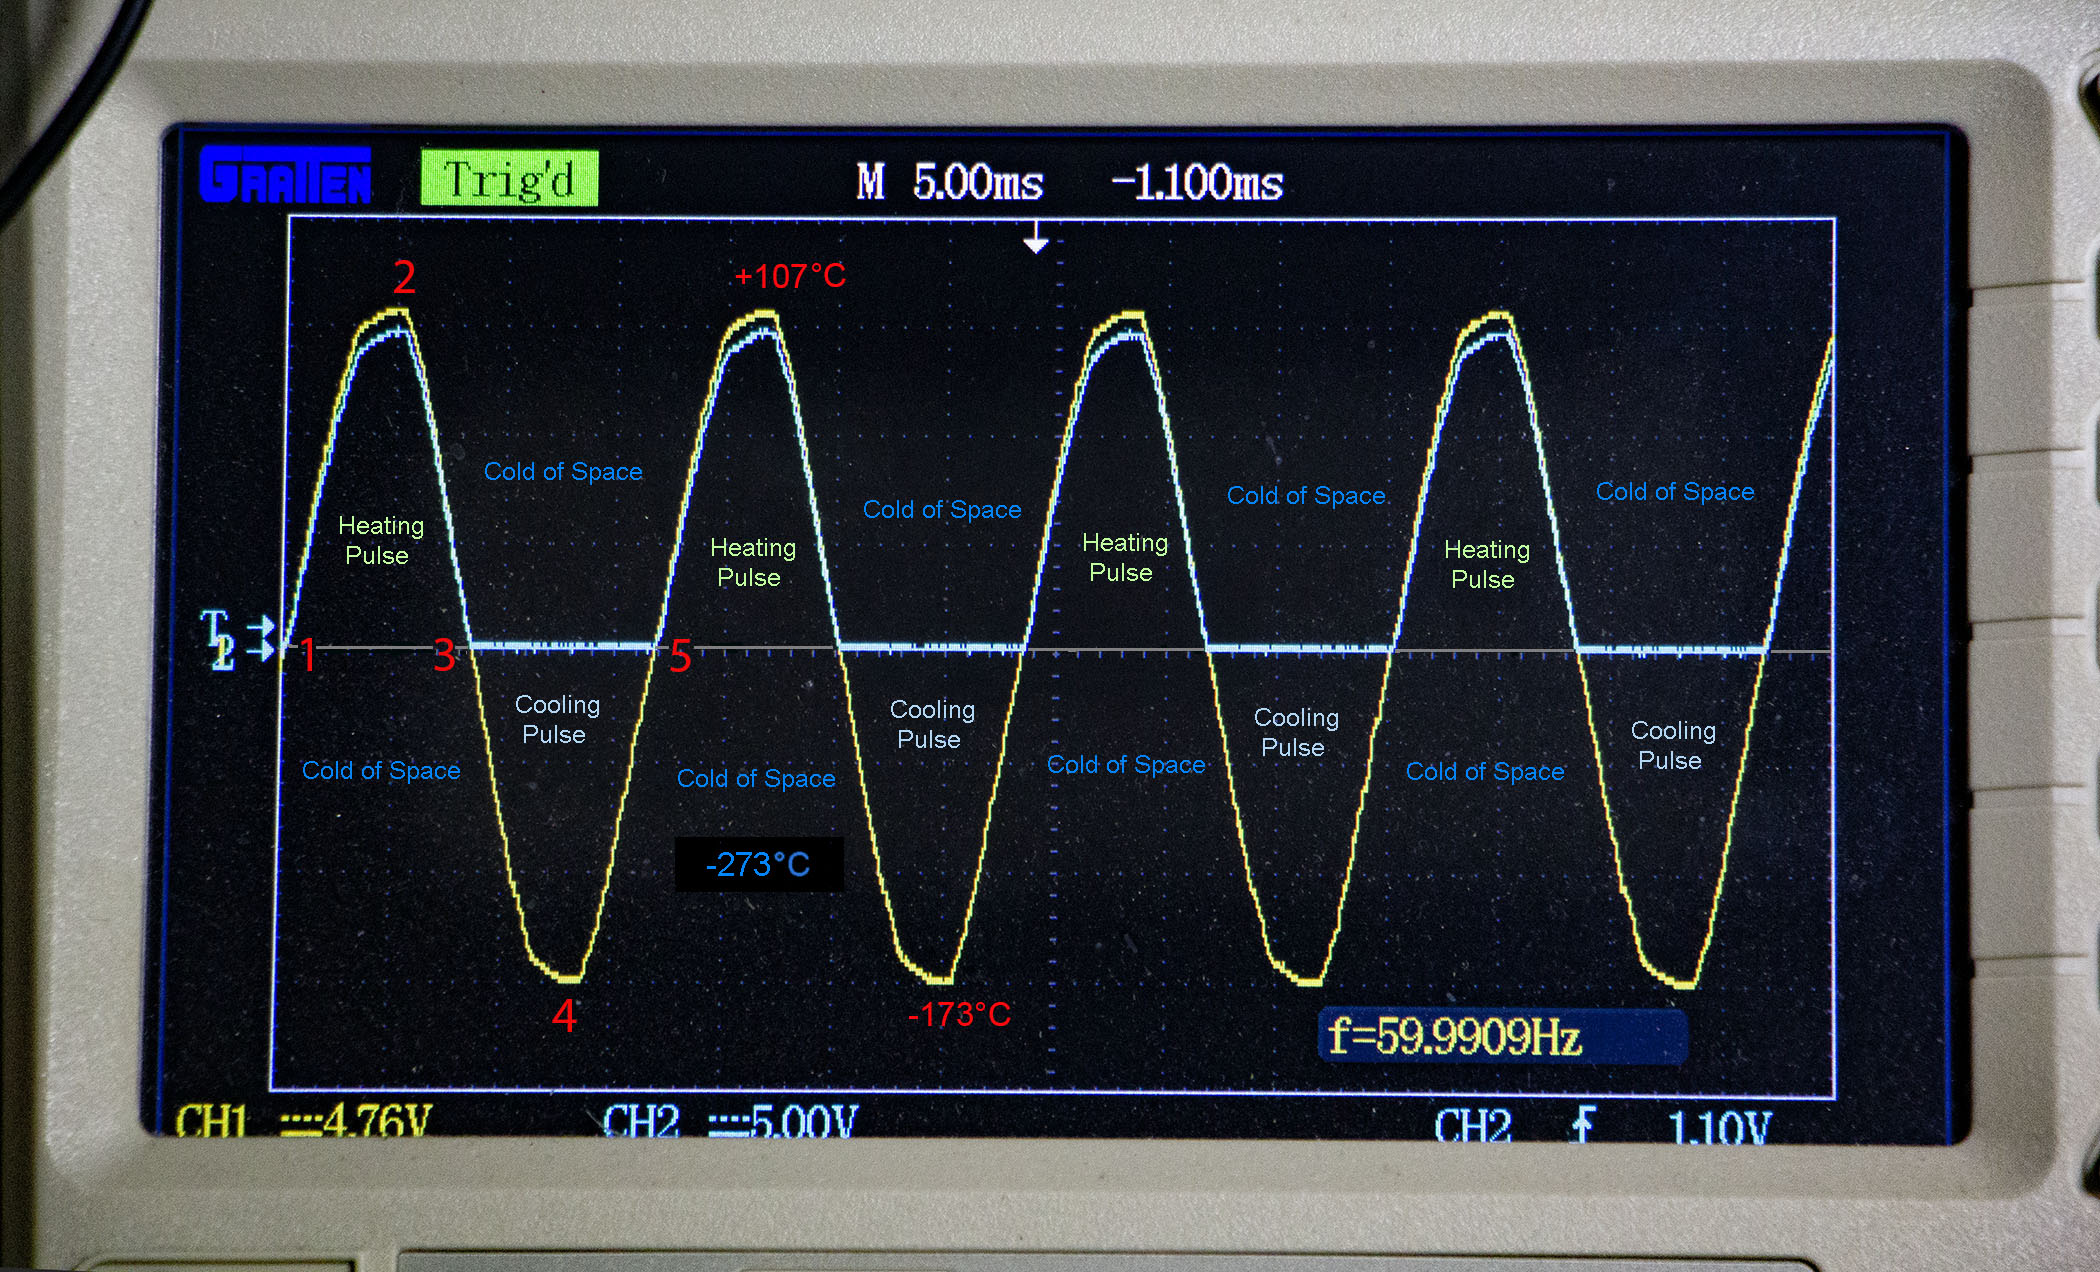
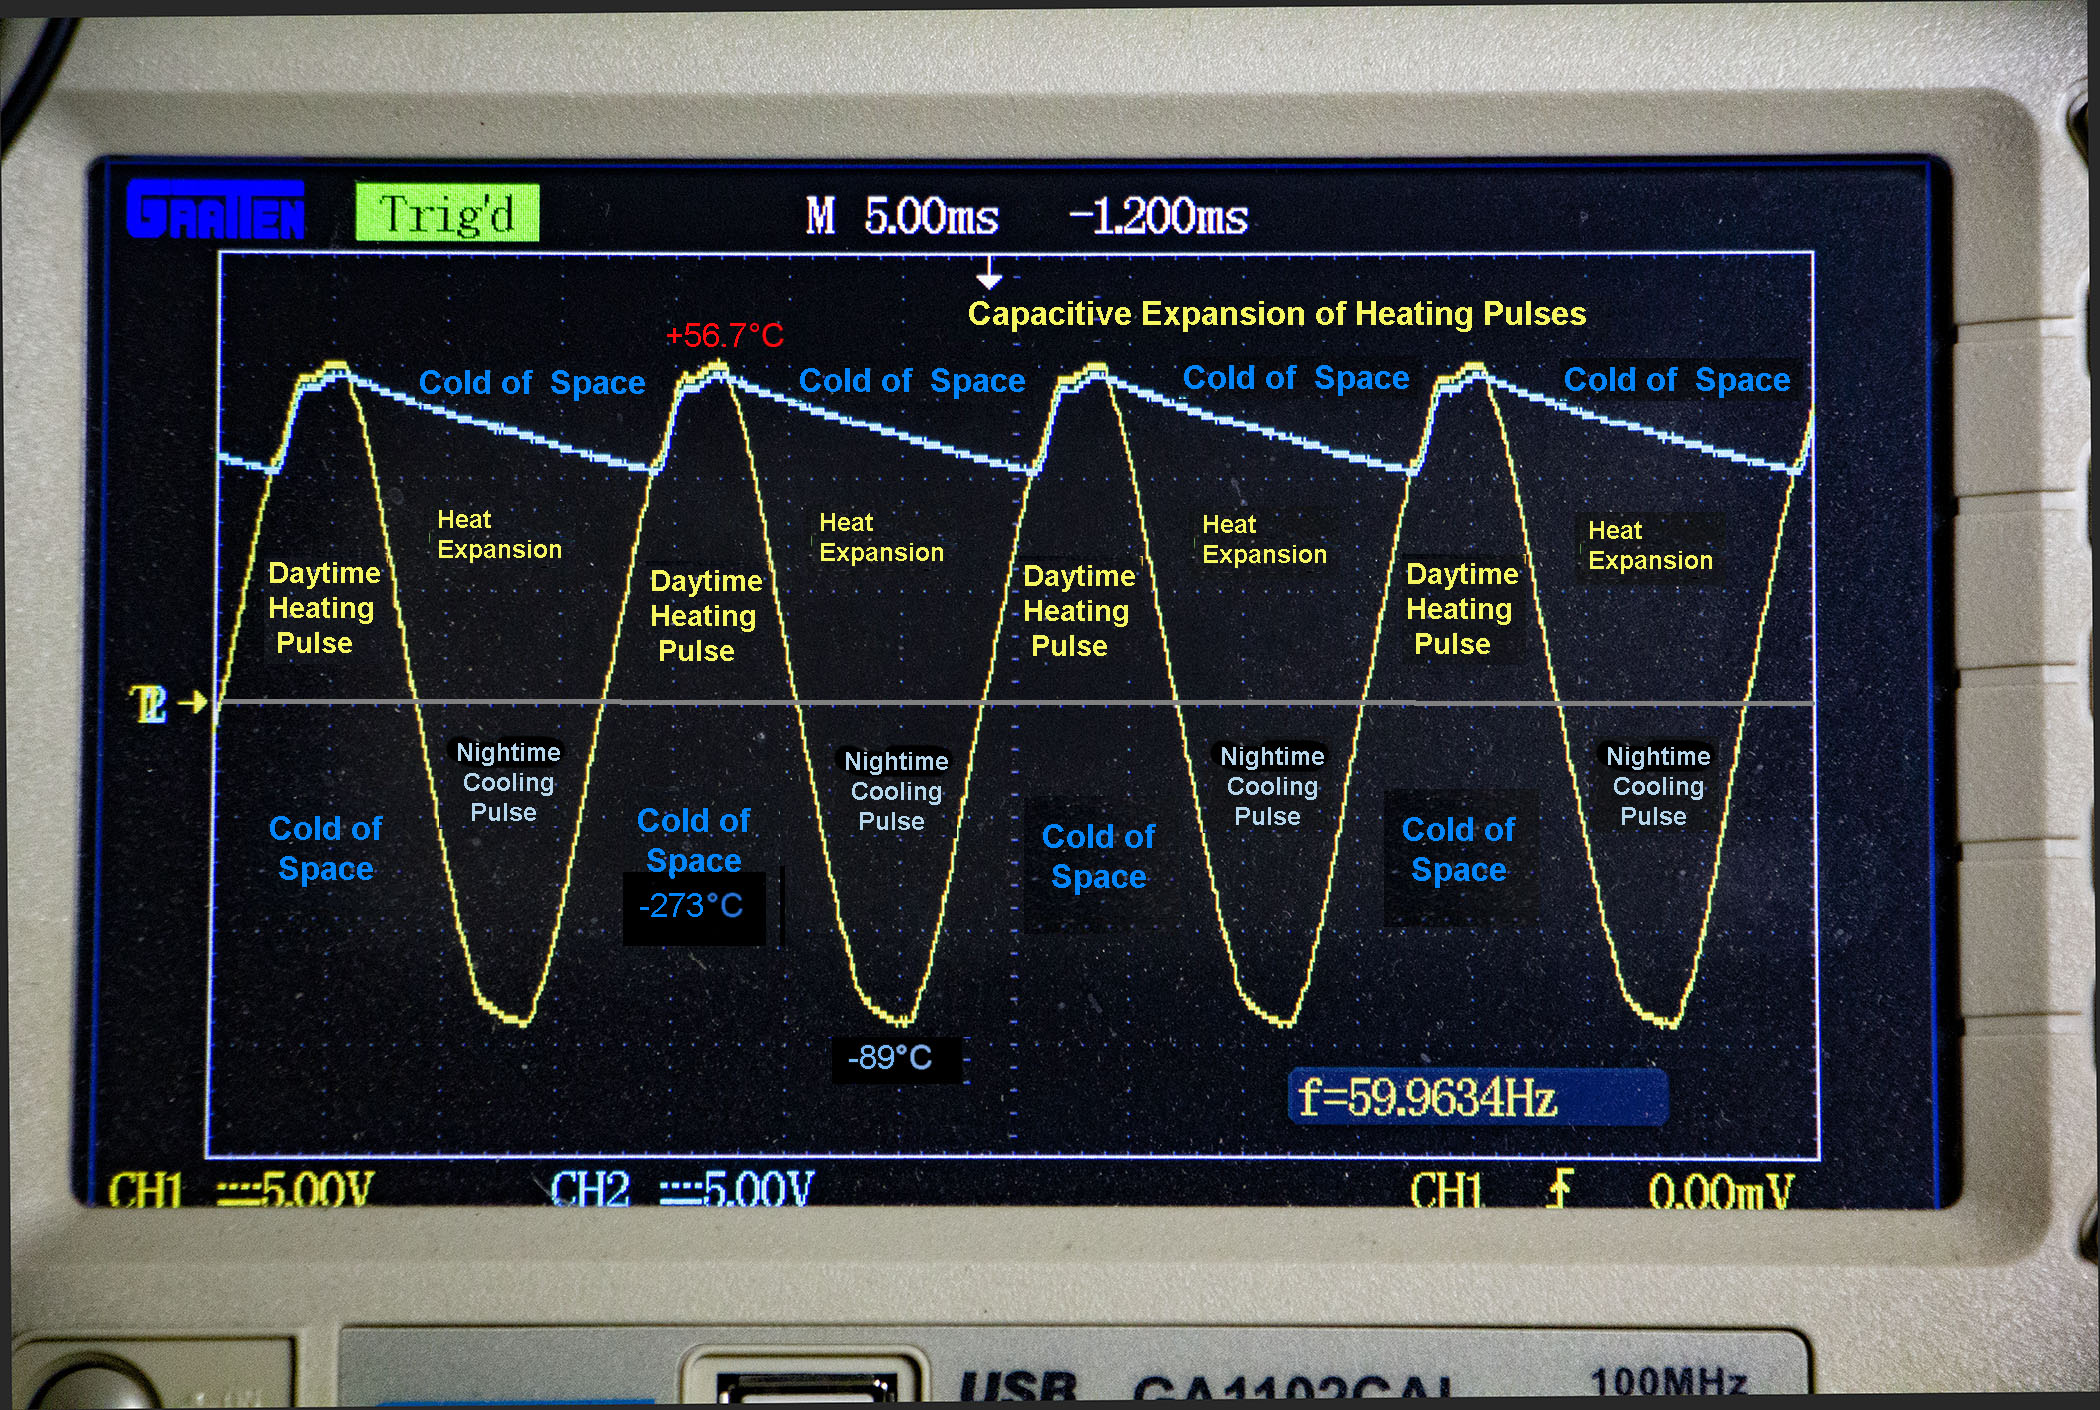
This half wave rectification without any capacitor in the circuit represents the Solar heating of our location on the globe. I have taken the liberty to number, in red, the
points of the first cycle. As part of the electrical current, the time span from 1 to 5 takes 1/60th of a second. As part of the Earth's rotation about its own axis, the time span from 1 to 5 takes 24 hours.
For an observer standing on the equator facing North, number 1 represents the local time when the sun first rises above the local horizon in the East towards the observer's right hand side, called "Morning". Number
2 represents the local time when the sun is directly over the observer's head, called "Noon". Number 3 reresents the local time when the sun dips below the local horizon in the West towards the observer's Left hand
side, called "Evening". Number 4 represents the local time when the sun is directly below the observer's feet on the opposite side of the globe, called "Midnight". Number 5 represents the local time marking
the end of the local day and the begining of the next local Morning.
Please note that our calendar days do not begin in the morning but rather at midnight. Also it is common practice to call the cycle's 12 hour positive lobe (from #1 to #3)
"Daytime" or simply, "Day".- and to call the cycle's 12 hour negative lobe (from #3 to #5) "Nightime" or simply. "Night". Thus our days become heating pulses while our nights become cooling pulses.
Our extreme environmentalists tend to forget about our cooling pulses. They claim the re-radiated solar heat at a longer wave length (infrared Light) gets trapped by
our greenhouse gasses, adding to the next day's heating.
Before this trapped heat can add to the next day's heat, it must completely neutralize the nightly cooling pulse that preceeds the next day. A tall order for only a fraction
of the day's Solar heat to achieve alone. Then there must be another equal amount of this heat just to bring the nightime temperature up to equal the daytime tempertature,- all before the next day begins. This means
the trapped Solar heat from a day must more than double a day's Solar heat in order to add any heat to the next day. Please note our half wave rectifier has already neutralized the cooling pulses.
As the greenhouse gasses behave as a global heat capacitor, we can use a variety of electrical capacitors to simulate the changing capacity of our global heat capacitor with
changes in this capacitor's size. Without a deeper look into the physics of both capacitors and gasses, our circuit resistor's resistance to electron flow, simulates the atmosphere's resistance to heat flow.
Thus we can use the above setup to gain some important insights into Global Warming and Climate Change.
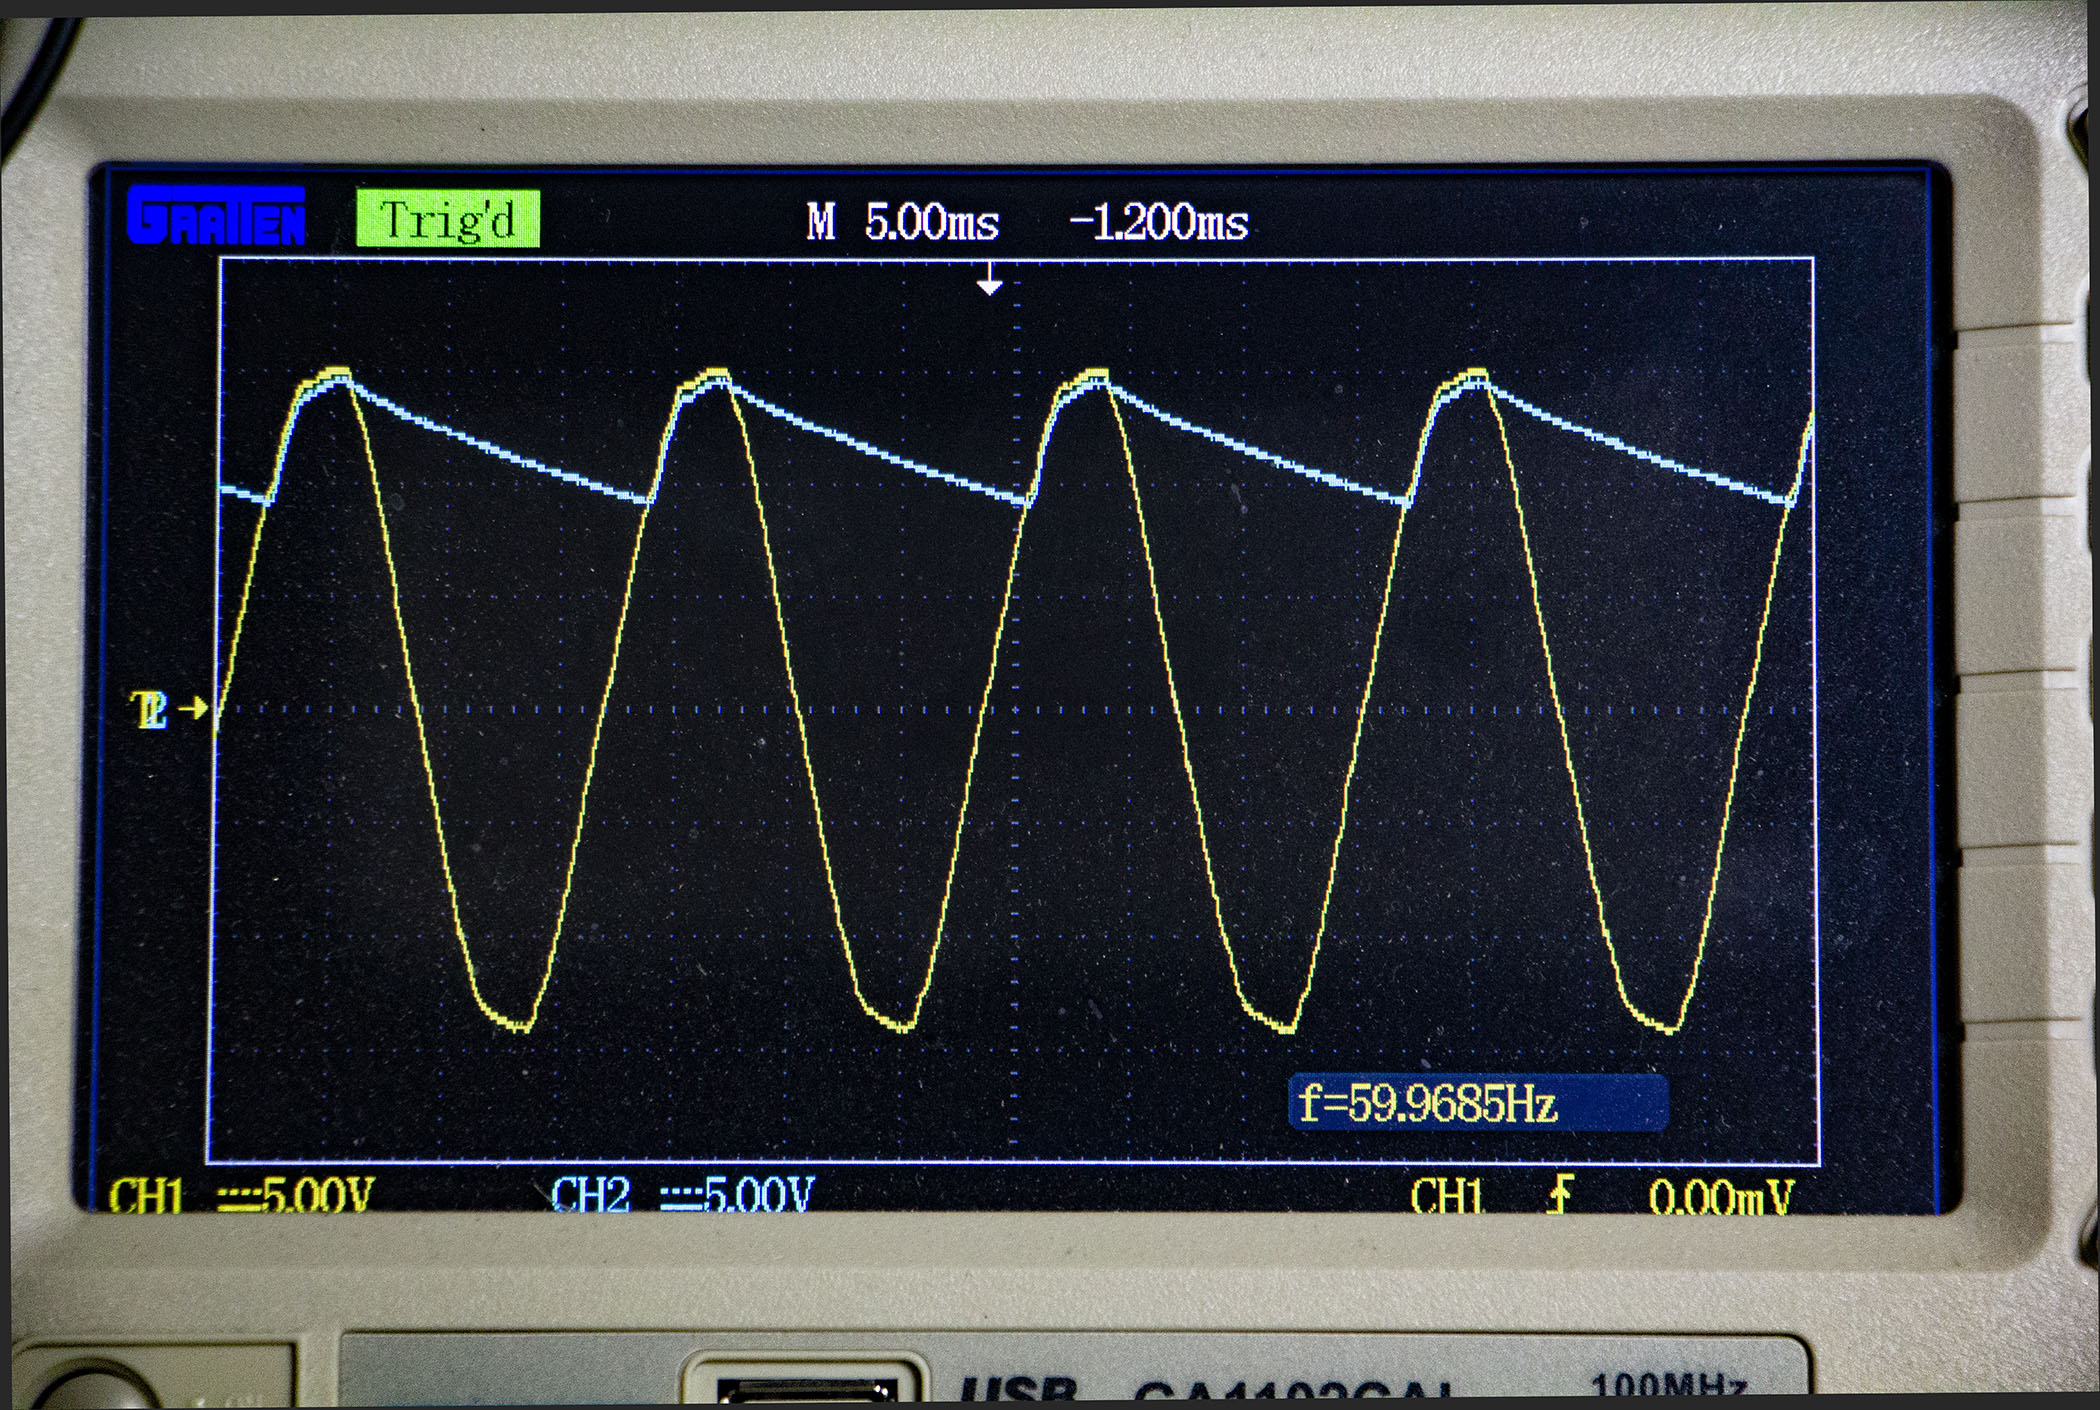
Here is a close-up of the trace produced by a 2.2 μf capacitor:
Here is a close-up of the trace produced by a 4.7 μf capacitor:
Here is a close-up of the trace produced by a 10.0 μf capacitor:
Here is a close-up of the trace produced by a 22.0 μf capacitor:
Here is a close-up of the trace produced by a 47.0 μf capacitor:
Here is a close-up of the trace produced by a 100.0 μf capacitor:
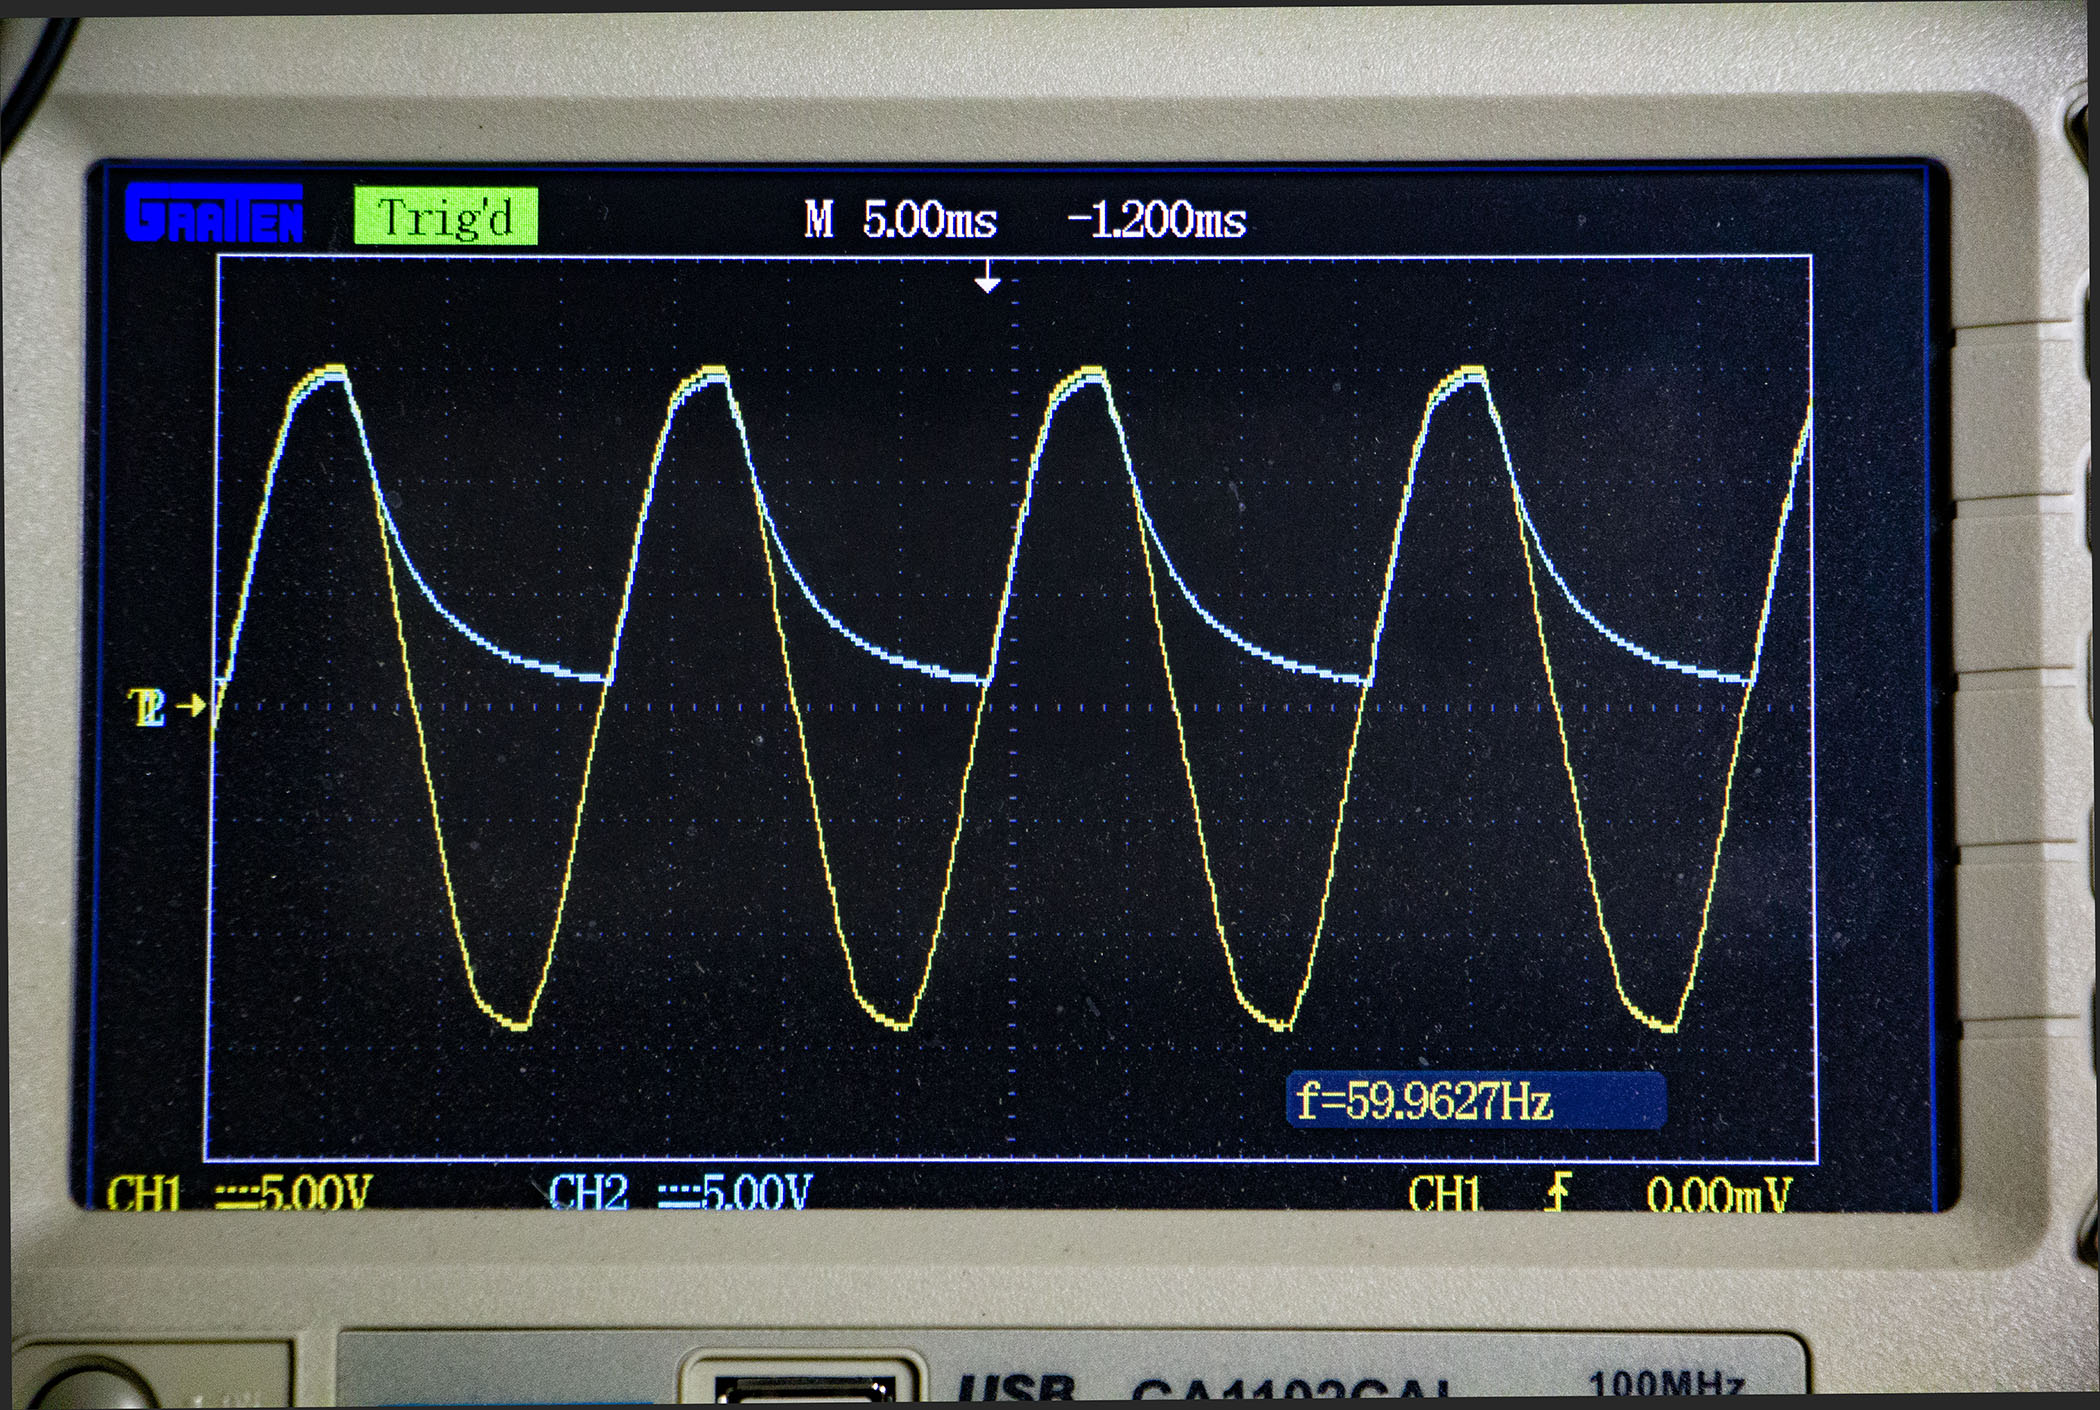
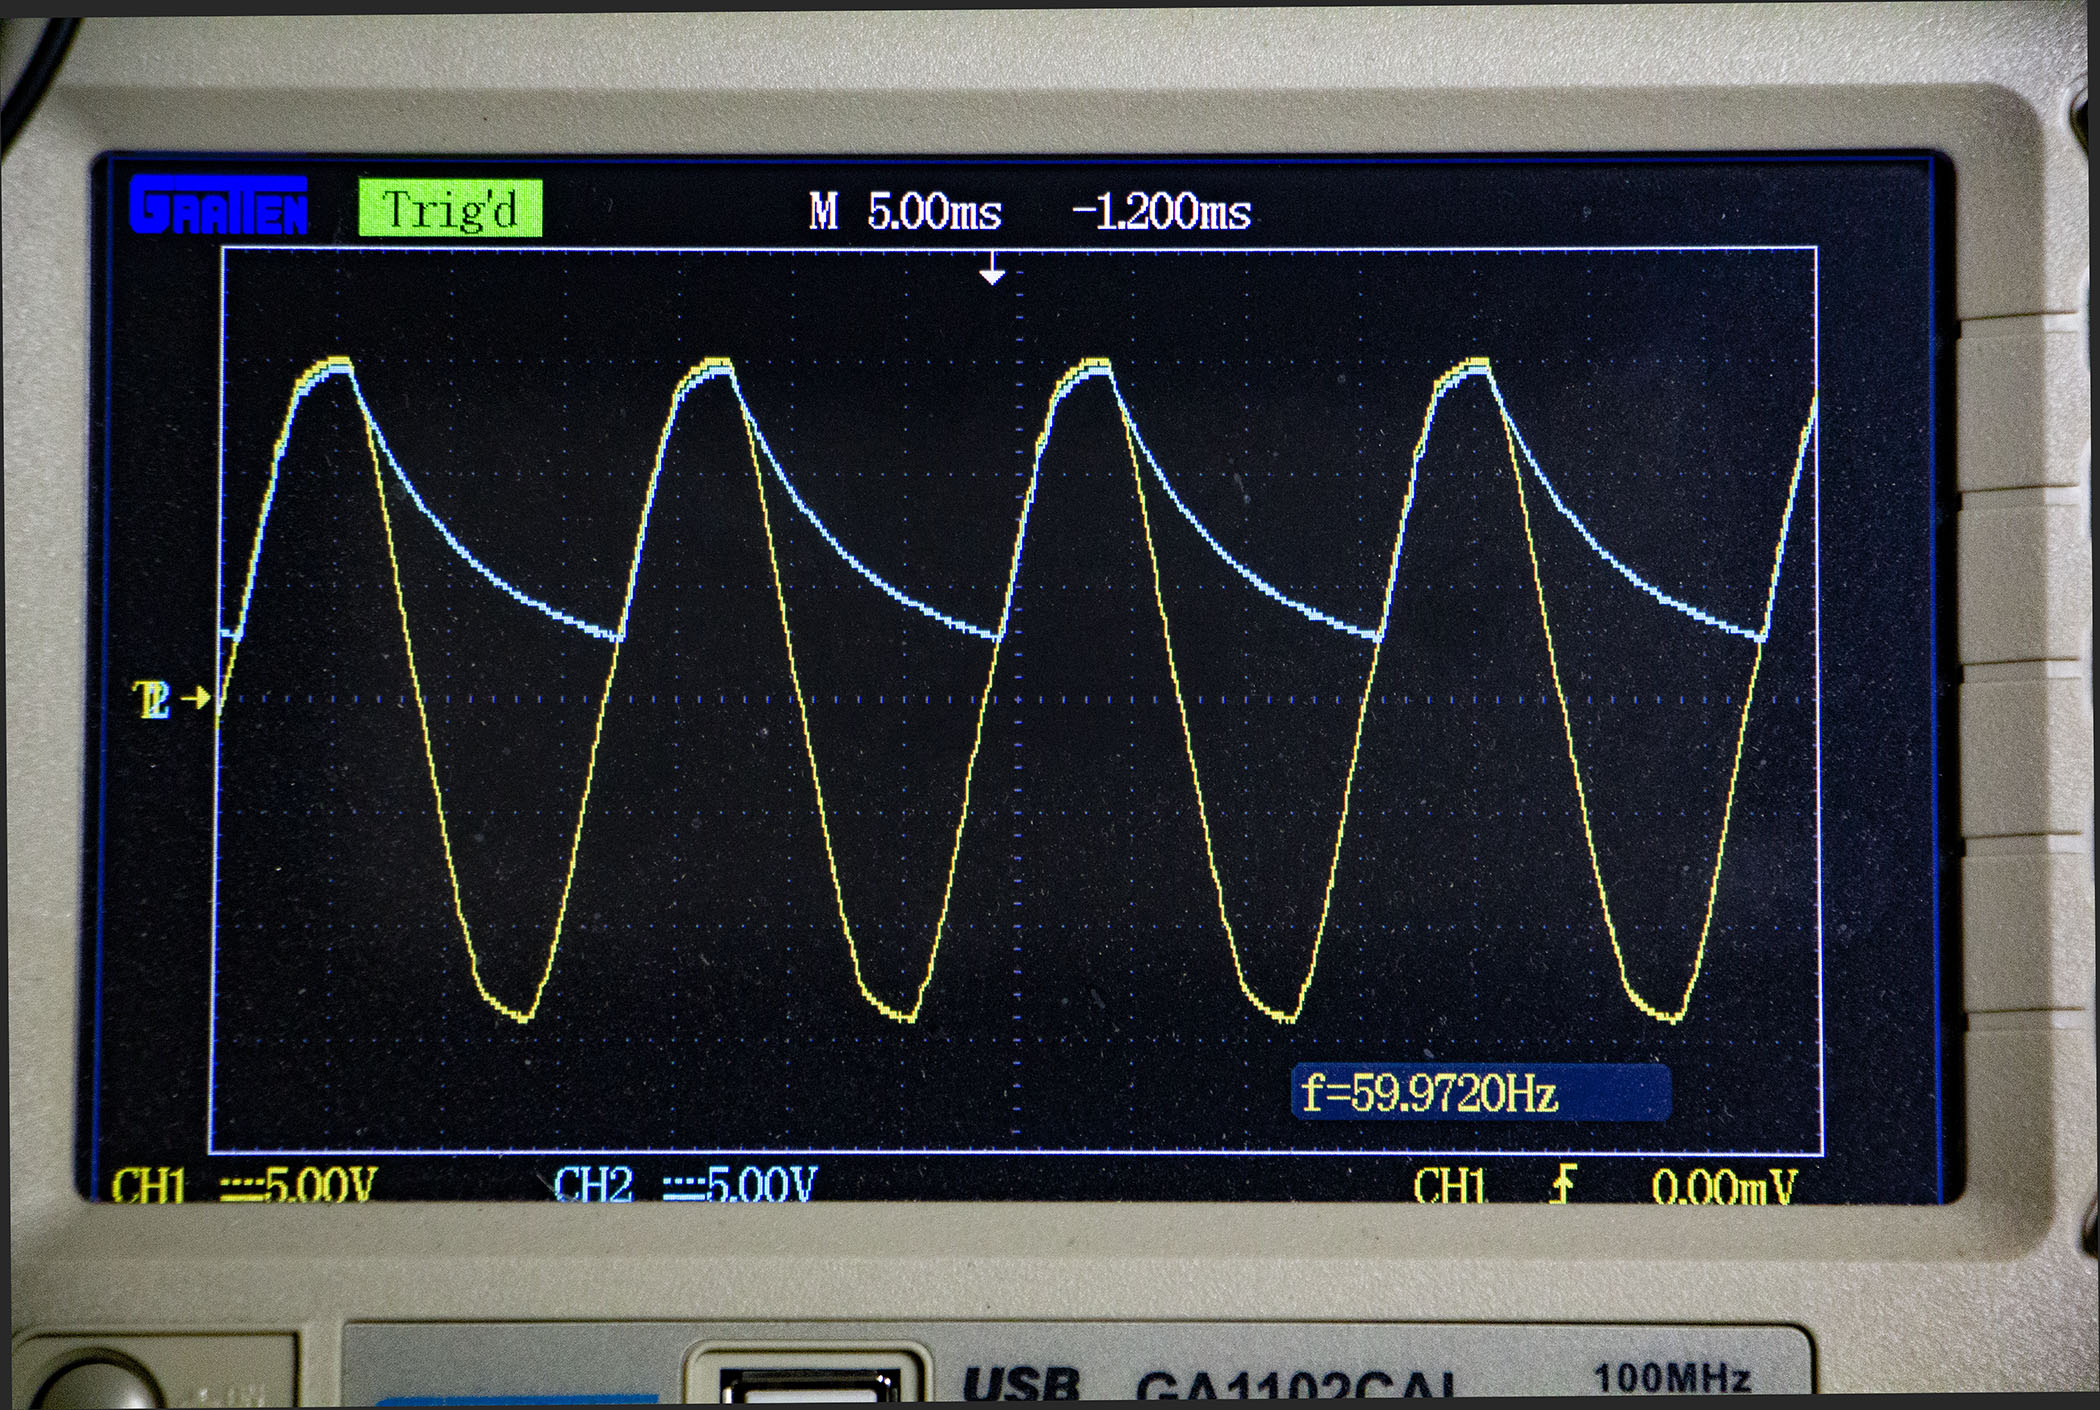
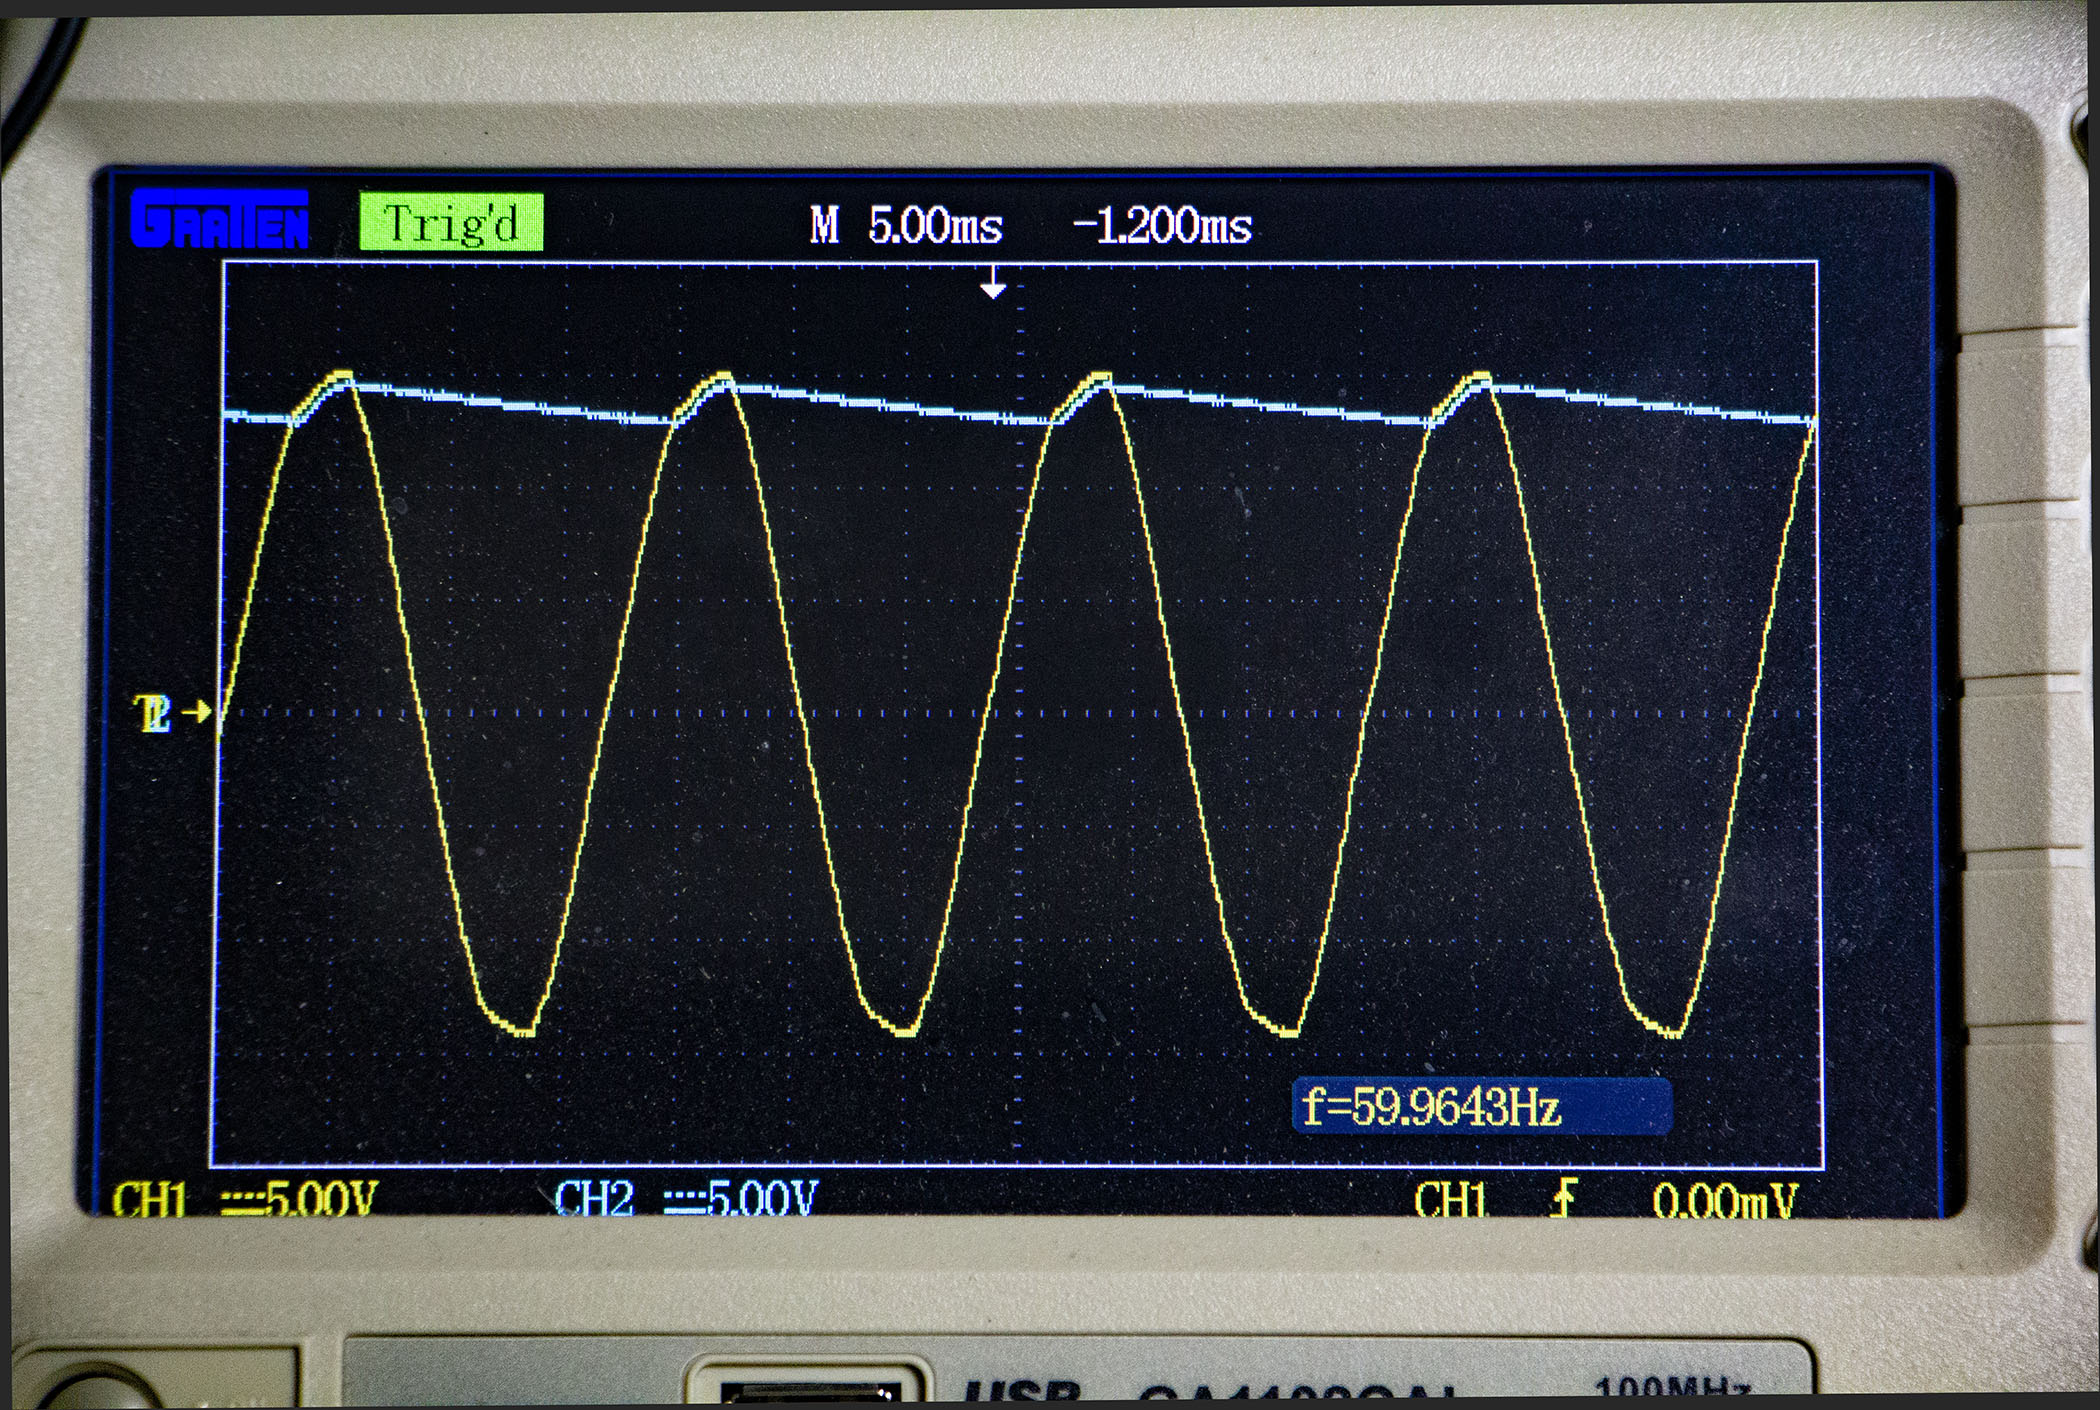
Here is a close-up of the trace produced by a 220.0 μf capacitor: Note the blue trace is beginning to look like a straight horizontal line.
Here is a close-up of the trace produced by a 470.0 μf capacitor:
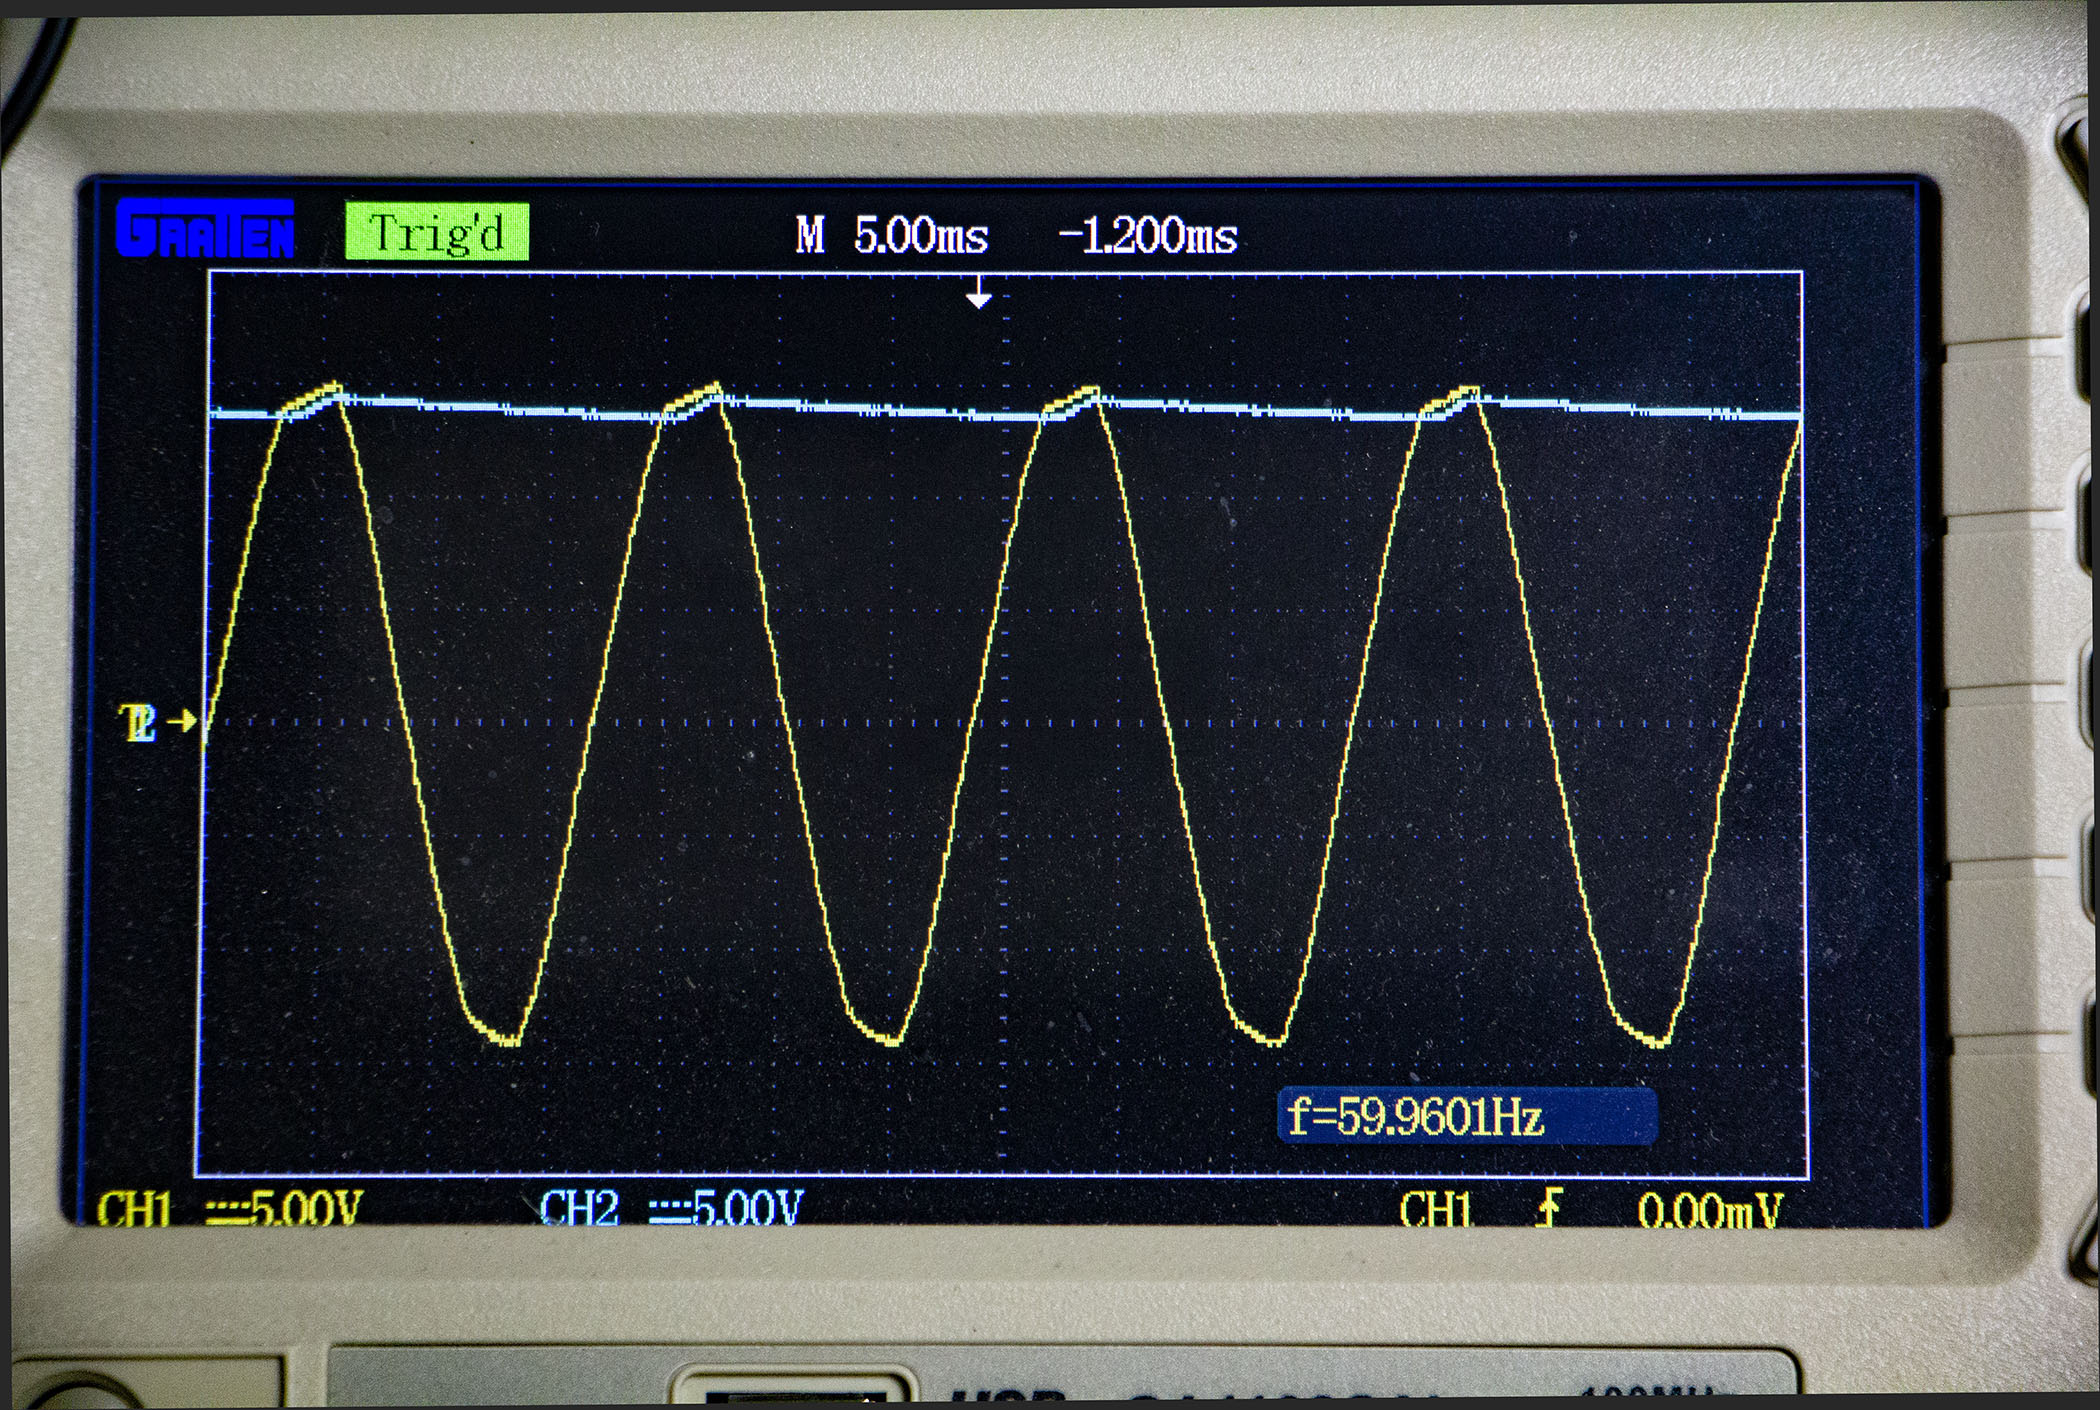
Here is a close-up of the trace produced by a 1,000.0 μf capacitor: Now the blue trace has really become a straight line. In terms of Global Warming,
this is where the nightime temperature is almost the same as the daytime temperature everywhere on Earth. A condition not seen on Earth since the beginning of the first age of dinosaurs.
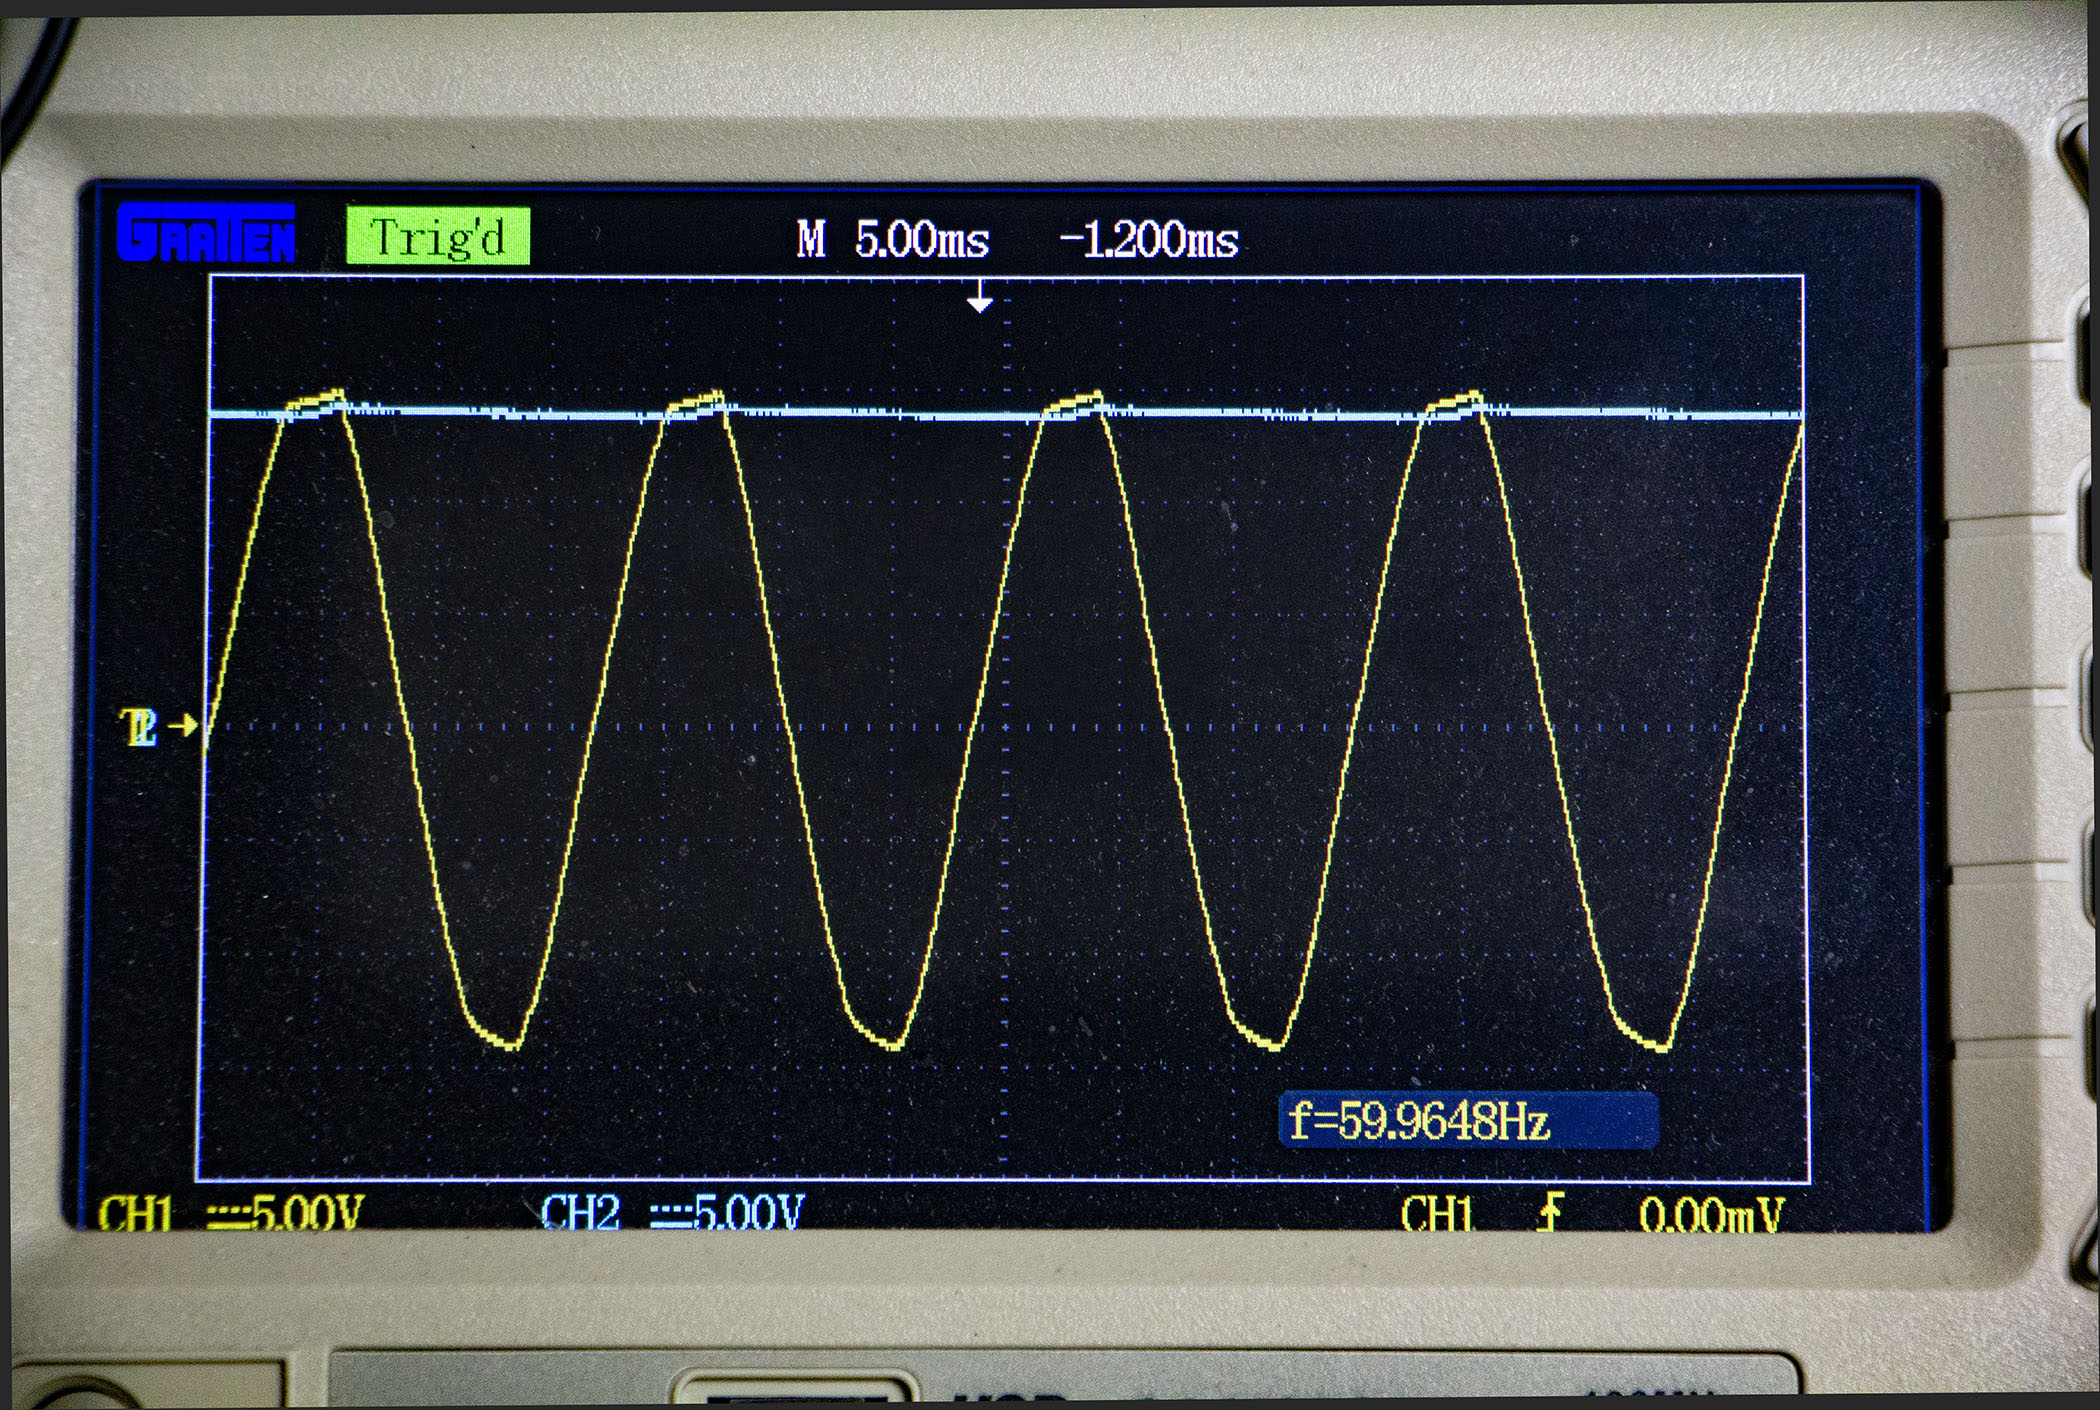
Here I have skipped the 2,200.0 μf capacitor to a close-up of the trace produced by a 4,700.0 μf capacitor only to get the same straight Line:
And finally a massive jump to a close-up of the trace produced by my 62,000.0 μf external capacitor still giving me the same straight line:
As this is the only power supply charging the capacitors here, none of these capacitors will be charged to a higher voltage than it provides. Had I
used a 20 volt power supply in place of my 10 volt power supply, all the capacitors would behave the same way, but the straight line would occur at a voltage that is twice the one shown here.
The 5 volts DC indicated by the scope is the voltage from zero to the positive peak. There is another 5 volts from zero to the negative peak making the voltage of the display 10 volts peak to peak,- nicely
fitting the 10 volt AC output of my power transformer in the power supply. Since I used electrolytic capacitors, there is a voltage where these capacitors will fail due to their construction.
This places a practical limit on the sizes of capacitors that can be used in this type of demonstration.
If the sun were to double the intensity of its heat output, the temperature at which the greenhouse gas capacitor would produce a straight line would
likewise double.
The point of this demonstration is that there is a value of capacitance that will smooth out energy fluctuations in an energy's supply that limits the energy to a
continuous value (straight line) that is equal to, the RMS or Root Mean Square value, of that energy's peak value. I call this value of capacitance the "Critical Filtering
Capacity or CFC. This is a property of the fluctuating energy not of a capacitor.
Here the CFC will change when the source frequency changes, thus increasing the global rotational speed would lessen the CFC while
decreasing the global spin rate would increase the CFC. I verified this using an external Sweep Function Generator to generate sine waves at 60 Hz, 120 Hz, 240 Hz, and 480 Hz where the CFC decreased from
220 μf to 100 μf, to 47 μf, to 22 μf respectively. Roughly: every doubling of frequency results in halfing the CFC.
As demonstrated here, any capacitance that exceeds the CFC fails to allow an increase in the energy level beyond the RMS level of the energy's source. ie;
increasingly larger capacitors never raise the blue trace higher than the peaks of the yellow trace.
In more practical terms: All the greenhouse gasses can do as far as temperature is concerned, is to raise the global nightime temperatures to equal the highest
global daytime temperature, They can never raise the nightime temperature higher than the normal daytime peak temperature, and cannot make the next daytime temperature get any higher.
If and when they make the nightime temperature and the daytime temperature almost the same everywhere on the globe, day in and day out, throughout all the seasons,- they will
have reached the global CFC of the sun's energy. At present, they are a far cry from doing this.
What they can accomplish is to keep the temperature level at almost the peak daytime level for extended lengths of time. Here the larger the
capacitor, the longer the time is extended,- without limit. I shall demonstrate this with the above euipment following an important digression.
Like all truly scientific experiments, these demonstrations are not valid unless they can be independently validated by duplication elsewhere. To that end I invite
you to repeat these demonstrations with the following caveat: That you use real hardware capacitors, real hardware components for the linear power supply circuitry, and a real hardware oscilloscope. It is far too
easy to unknowingly employ the deliberate errors built into many of today's hardware emulating software applications. This link will take you to my schematic diragrams and construction notes.
What I have shown you so far, has been demonstrated countless times at trade schools, community colleges, and universities all around the world prior to Al Gore's rise to
power.
I am aware of at least one hardware emulating software application that allows an engineer, or engineering student, to select electronic component-symbols from a vast
data base of electronic components,- and subsequently place the selected symbol in his or her schematic circuit diagram. When all the desired component-symbols have been placed in the diagram, software instruments
emulating their real counterparts are used to examine how the circuit in the drawing will behave,- as though real components had been assembled according to the circuit diagram.
This particular hardware emulating software application supports the phony calculus expressions I mentioned earlier, allowing the emulated capacitors to charge up to a
voltage that is higher than the voltage of the power supply that is charging them. Engineering students are taught they are cheating if they include the return path to the power supply in their active drawings.
Although this app will not run if the return paths to the power supply are included, these students are not "would be cheaters", as it is a fundamental law of electricity that electricity can only
flow in complete circuits. Showing the return path to complete a circuit is not a cheat.
It is the software engineers who developed this application who are the apparent cheaters. In requiring the client engineers to apply the circuit ground-symbol in place
of the return path to the power supply, these clever software developers make it possible to add a hidden power supply sharing the same ground,- allowing the capacitors to charge up to the higher voltage of the hidden
power supply. However, I do sympathize with these developers, in that showing many return paths in a complex circuit can really clutter up a schematic diagram rather quickly. Also the requirement to allow
client engineers to choose any voltage they want for their designs,- made it mandatory to provide the app with an infinite voltage power supply from which any
number of lesser voltages can be tapped off and applied to various circuit nodes. In order to charge the capacitor to a higher voltage, all one need do
is to assign a higher voltage to the node created by the junction of the rectifier diode with the capacitor. Sadly, Mr. Gore's wordsmiths abuse applications
like this to spread their lies.
Our extreme environmentalists contend the rise in temperature produced by mankind's greenhouse gas production has now reached crisis proportions,- using their hidden power supply
to erroneously show how the increased greenhouse gas capacitance can raise the temperature beyond the sun's normal fluctuations, ie. raising the blue trace well above the yellow trace.
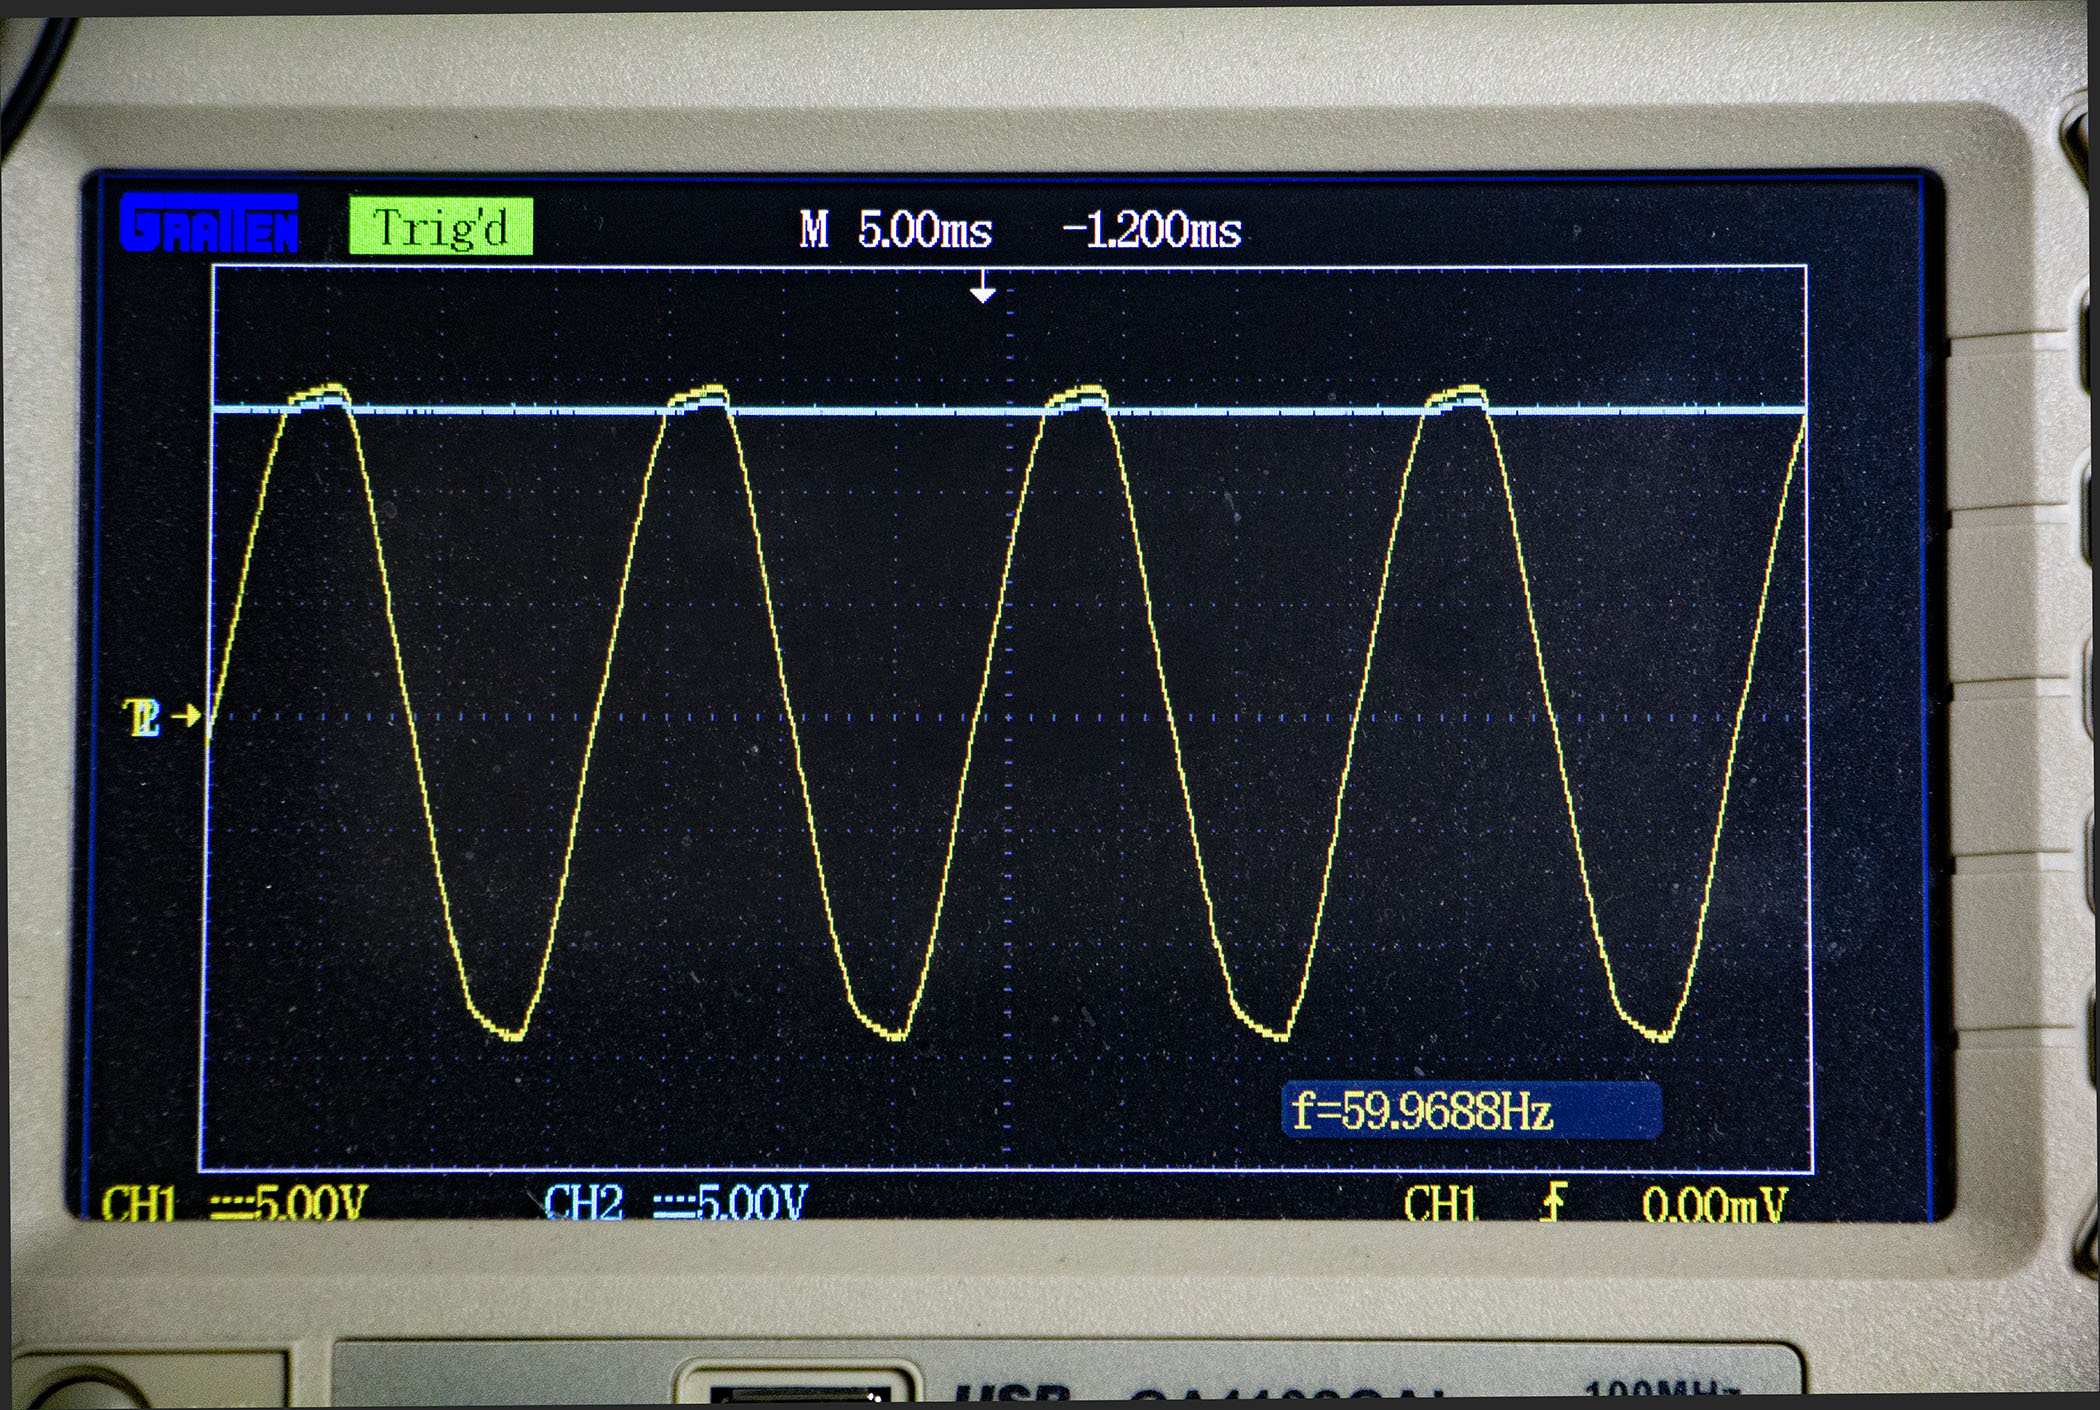
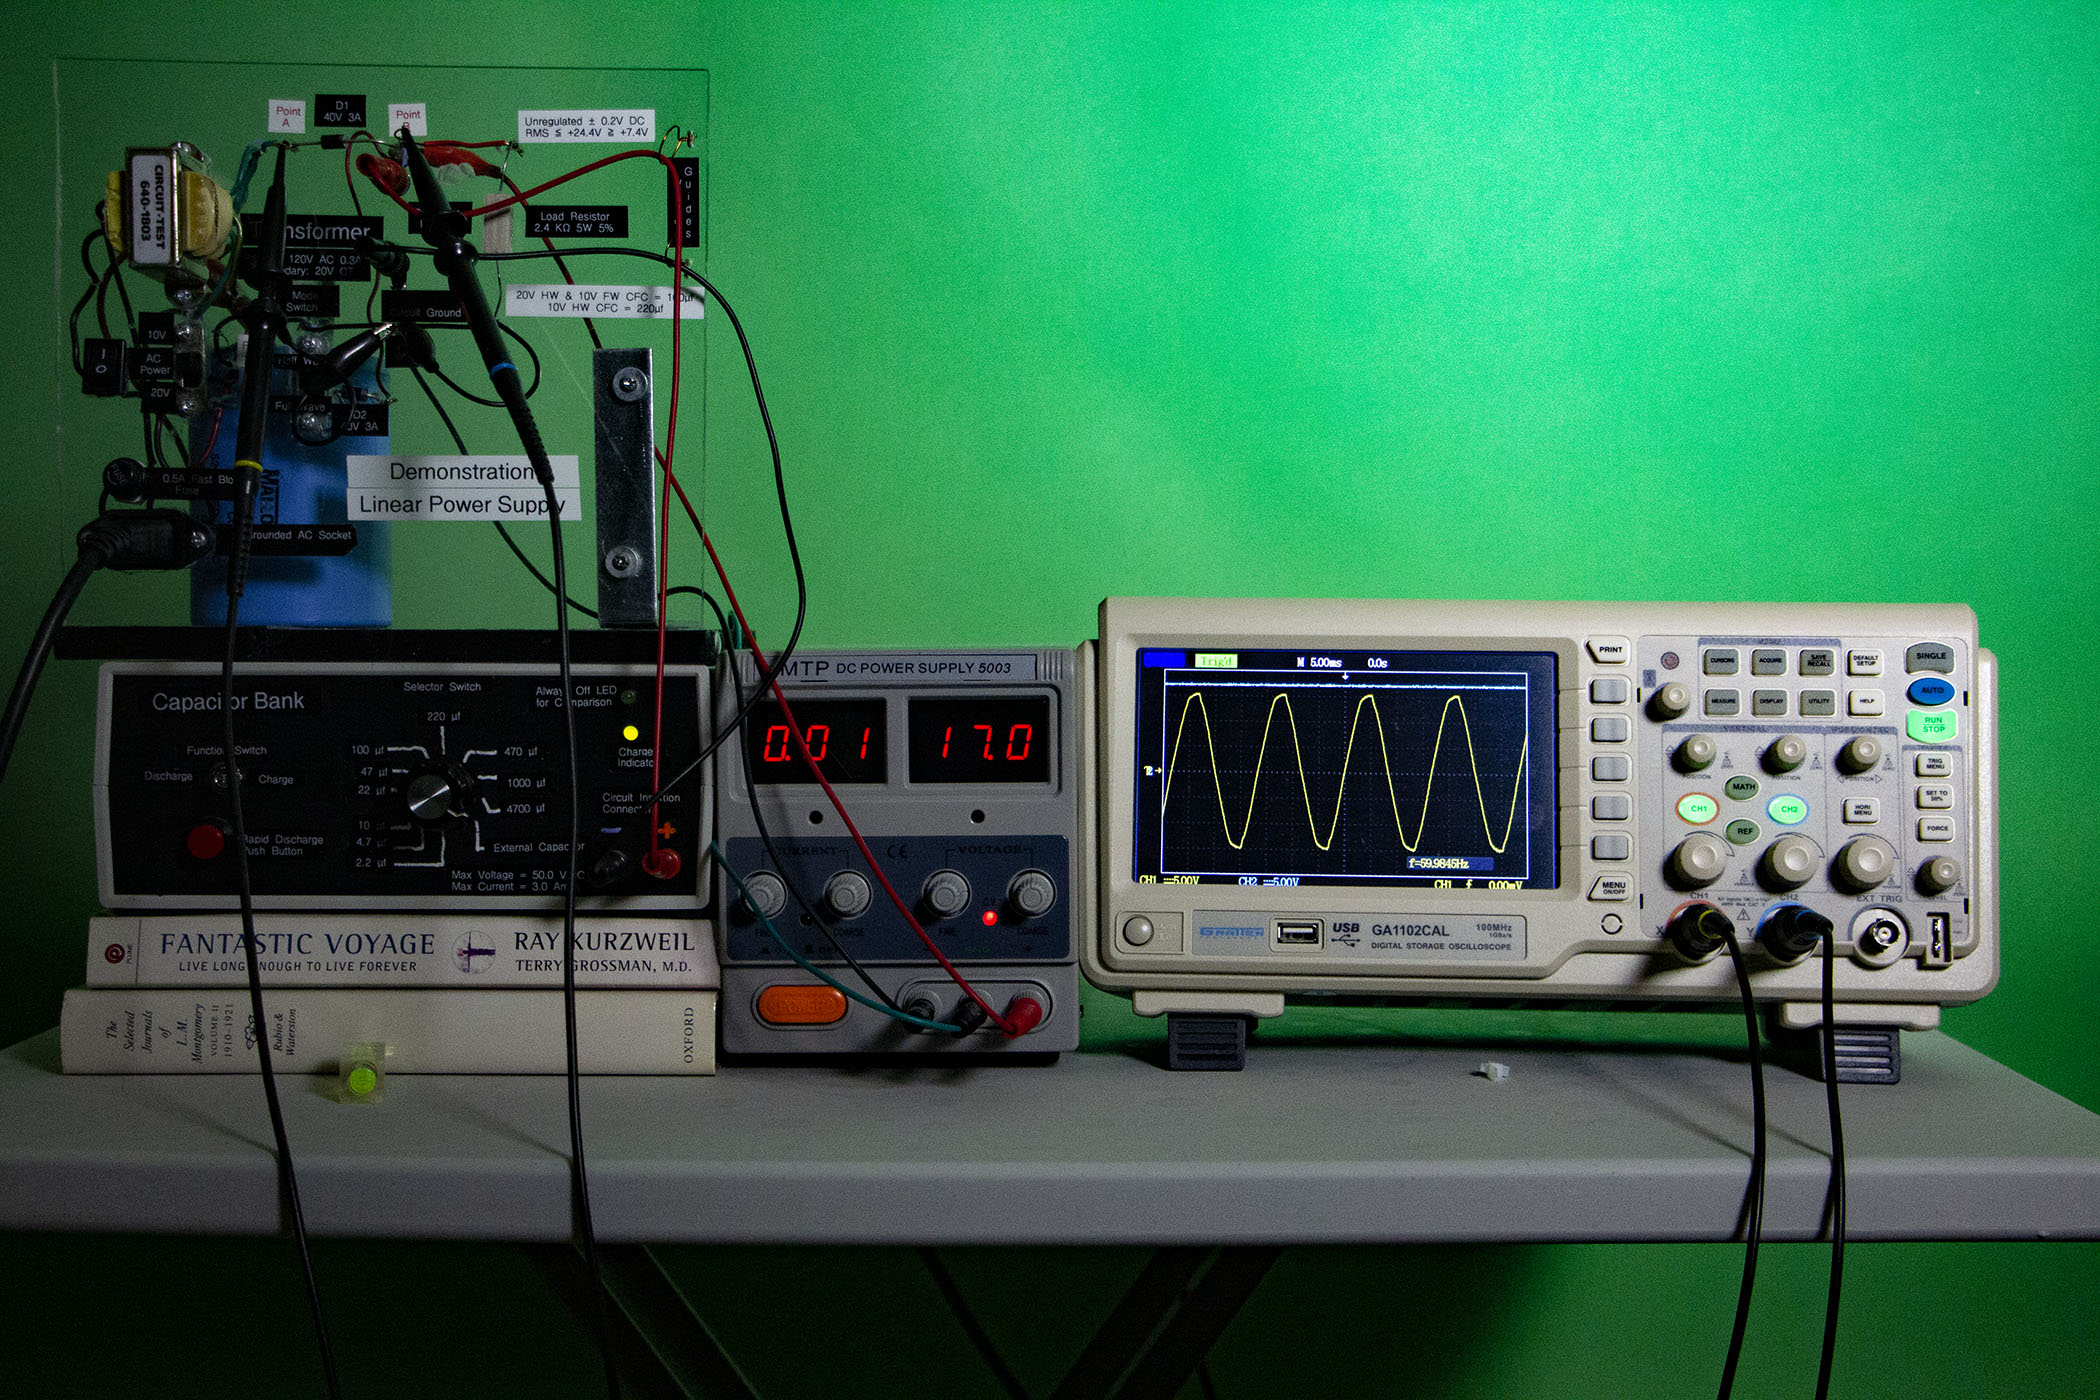
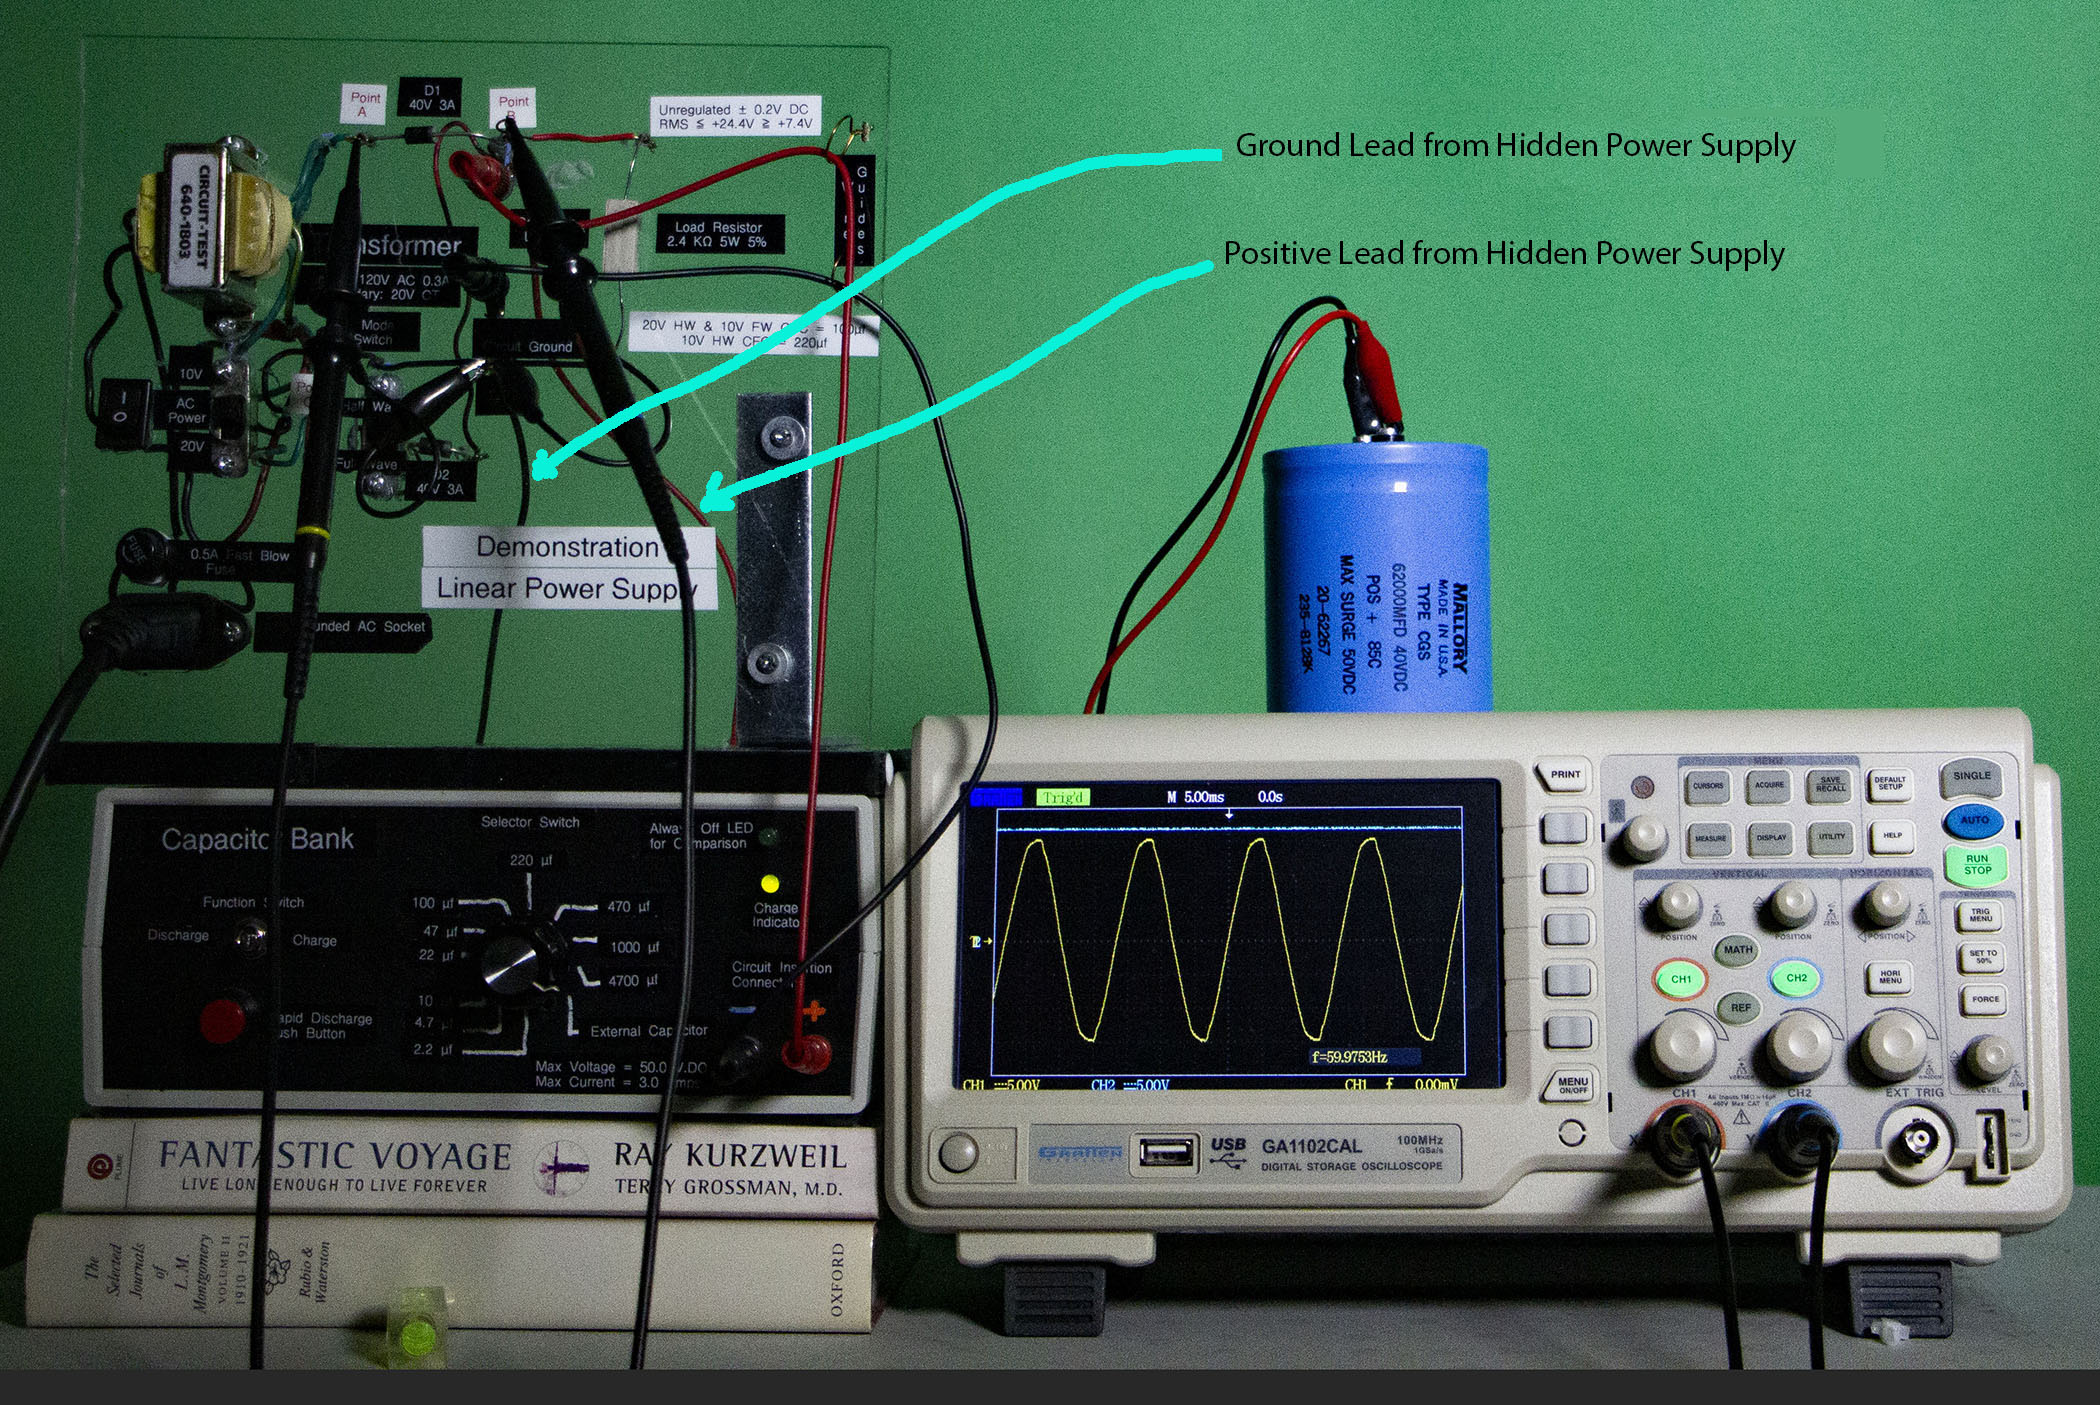
I have used an extra out of sight power supply (visibly centered in my setup below) to raise the temperature of my simulation above the simulated temperature fluctuations of the sunlight, also raising the blue trace
well above the yellow trace. Only my extra power supply represents the equaly out of sight undersea volcanoes,- instead of an increased sized greenhouse gas capacitor which as I have already demonstrated cannot raise
the temperature above the CFC.
Here I've placed the large external capacitor on top of my extra power supply, and hid the still running supply behind my setup.
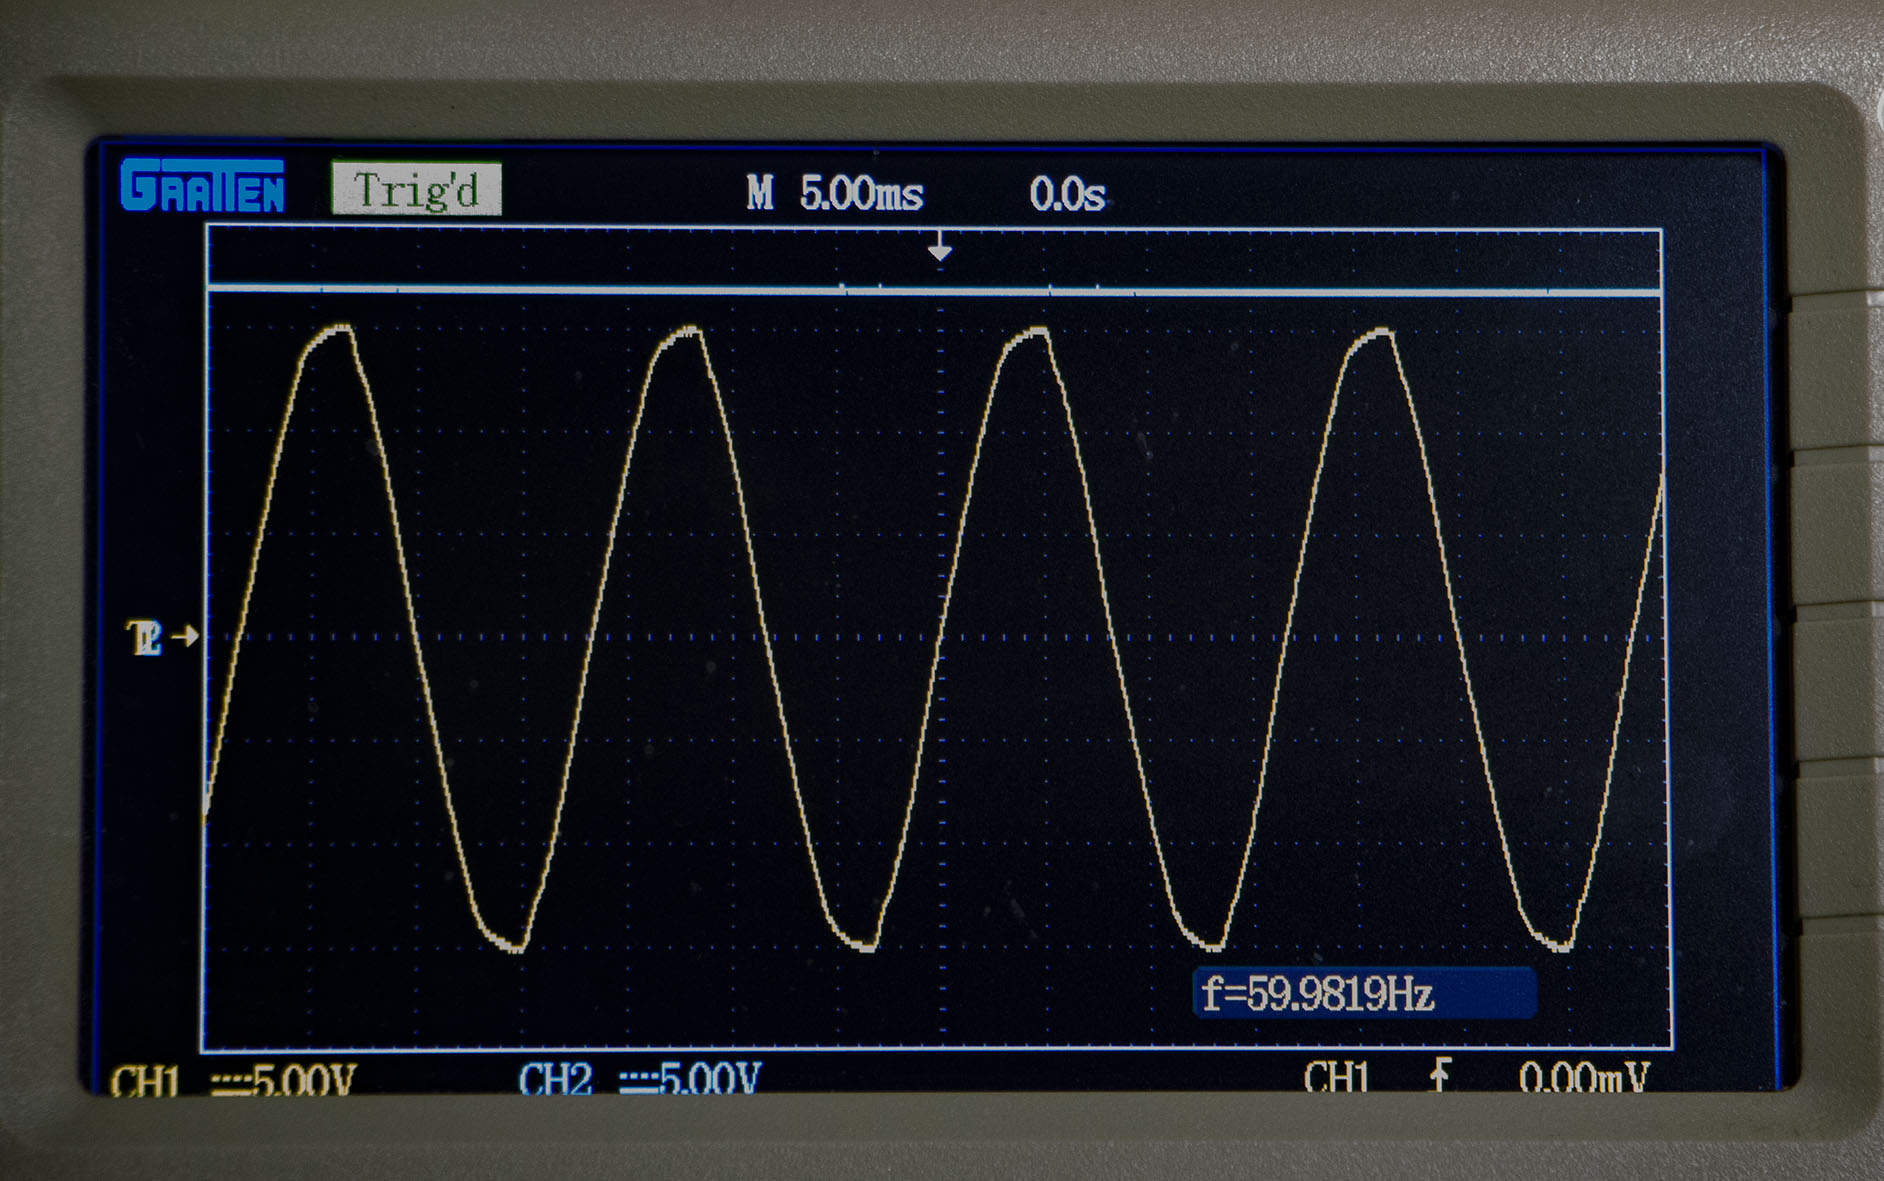
Finally, here's the oscilloscope close-up of the Blue trace above the Yellow trace.
In the following video I shall demonstrate all that I said above,- running through all the capacitors using my power supply's 10 volt mode and again using the supply's 20 volt
mode. Then I shall connect my extra power supply to raise the blue trace above the yellow trace showing the undersea volcanoes are the only
heat source that can raise global temperatures above the peak temperature provided both directly by the sun and re-radiated by the Earth. Finally, I shall demonstrate how increasing the size of a capacitor, increases its discharge
time, allowing the greenhouse gas capacitor to prolong the maximum heating period according to its size,- without limit.
As I am not satisfied with this video, I am working on an improvement where I am building a digital
timer that will monitor the active green LED, counting every thousandth of a second from 1/1000 sec to 99 minutes. I have completed the design, and
am now collecting the appropriate components. I believe this will greatly improve my demonstration.