

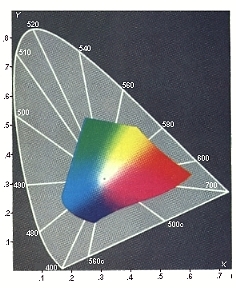
 The CEI Chromacity diagram actually describes
a Two Color System for mixing colors. Being a two dimensional system
it cannot show 3 variables very well. However, it depicts a color's Hue
(Wavelength) and Chromacity (Saturation) with enough accuracy that the
color's Luminosity or brightness can be worked out.
The CEI Chromacity diagram actually describes
a Two Color System for mixing colors. Being a two dimensional system
it cannot show 3 variables very well. However, it depicts a color's Hue
(Wavelength) and Chromacity (Saturation) with enough accuracy that the
color's Luminosity or brightness can be worked out.
A color's luminosity can be divided into two
portions, of which the luminosity can be completely one, the other, or any combination
of the two. The first portion is Luminous Excitance, which can be any
value from 0% to 100%, and represents the amount of brightness in the illumination
due to a specific hue. The second portion is either called Luminous Transmittance
or Luminous Reflectance,- depending on the source of the illumination:
ie direct light or reflected light. It too can vary from 0% to 100%. This
portion of the color's luminosity is the amount of brightness that is neutral
in color. Both portions complement each other as they are parts of the same whole.
A color is specified by giving its X-Y coordinates and a notation as to its
Luminous Transmittance or Luminous Reflectance. The most confusing thing
about the diagram is that a color's Chromacity Line coincides with it's
Luminosity line. It divides into two portions at the same point where the
Luminosity divides, resulting in a confusion of terms. This is not a
fault of the system, but a consequence of the fact that Luminosity tracks the
light wave's electrical field, while Chromacity tracks the light wave's magnetic
field, with both fields in phase and sharing the same wavelength and magnitude.