 A major consequence of this last formula is that
any single color can be mixed with a large variety of other colors to produce
every single color in the visible spectrum.
A major consequence of this last formula is that
any single color can be mixed with a large variety of other colors to produce
every single color in the visible spectrum.
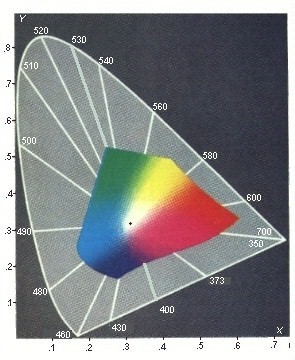
Note: The 400 nanometer mark on this diagram
agrees more closely with the spectral dispersion at Violet, instead of midway
through the Blue as on the standard CEI diagram.
Also the color "Magenta" now has its proper
wavelength of 373 nm in place of the "fishy" complement of Green at 500c nm.
The whole bottom of the horseshoe has been changed according to the "cyclic
nature of the spectral the colors belong to." The colors along the sloping
sides of the horseshoe have the same wavelengths as before,- preserving the
functionality of the diagram.

