
In a nutshell: The Seabed method is extremely sluggish in its response to climate change, but this is
compensated for in that it has an intrinsic property that yeilds extremely accurate temperature data. The Ice Core method is very
rapid in response to climate change, but has absolutely no property allowing for temperature data.
.
The seabed method depends upon the fact that the water containing the lighter isotope of oxygen floats on top of the water containing the heavier isotope of water.
Enter the planktic varieties of a microscopic shell fish called Foraminifera. that live in the surface waters of the ocean. These tiny creatures incorporate the oxygen molecules from
the water in which they live into their shells made of Calcium Carbonate (CaCO3). Thus their shells contain the oxygen molecules with the oxygen isotope
that was prevalent during their life-time. When these creatures die, their shells sink to the bottom of the ocean, forming a large part of the oceans sediment on the seafloor.
While our climate is like it is now, the surface waters of the ocean evaporate and form clouds that are blown over the adjacent land masses where the water precipitates out as
rain or snow. Most of this water finds its way back to the oceans through our rivers and streams, replenishing the ocean with water containing the same isotopic composition that had been
evaporated from it in the first place.
It is important to note the ocean waters are evaporated by the combined heat from both the sun and the undersea volcanoes. When the sunlight becomes too weak to
evaporate the ocean waters, due to changes in the Earth's tilt, the undersea volcanoes continue to evaporate the ocean waters at a reduced rate. Now when the water containing the lighter isotope of
oxygen is blown over the land masses, the weak sunlight cannot keep it in the atmosphere, and it snows a lot more during the winter months. The summer's weaker heat gets shorter and shorter as the years
go by untill it can no longer melt all the snow and ice from the winter season. Thus the snow and ice from one season adds to the snow and ice of the next season.
This process continues year after year building up the great continental ice sheets we call glaciers. Such periods are called Glacial Advances or Glaciations
and cover 2/3 of the globe in miles thick ice for about 40,000 years. Mr. Gore mistakenly refers to these periods as ice ages. True ice ages cover the entire globe in miles thick ice for millions of years.
During a glacial advance, the lighter isotope of oxygen in the water from the oceans that was blown over the adjacent land masses is locked up in the great ice sheets and cannot get back
to the oceans. This depletes the oceans of water containing the lighter isotope of oxygen, so that the deeper water containing the heavier isotope of oxygen replaces the surface water that was evaporated away.
Now the planktic species of foraminifera living in the surface waters begin to incorporate the heavier isotope of oxygen into their shells.
By drilling down into the seabed we can extract the various layers of the ocean's sediment and chemically examine the isotopic composition in the foraminifera shells of each layer.
Here changes in the O2 isotopic composition of these shells reveals our climate history going back millions of years.
Another variation of the seabed method examines the differences in the Carbon 13 (13C) isotope found in the Calcium Carbonate
(CaCO3) of both types of
foraminifera. Here seaweed contains less 13C than is found in the Dissolved Inorganic Carbon or DIC found in the surrounding waters. This is due
to the fact that the photosynthesis process used by the seaweed prefers Carbon 12 (12C) over Carbon 13 (13C).
The ratio of 12C to 13C found in a fossil called PD Bellamnite or PDB is used as a
standard measure. The ratio of 12C to 13C found in the CaCO3 of the planktic
foraminifera is measured and expressed as the deviation from the standard, and is given as the δ13C in parts per thousand, (0/000). This is also done with the
12C to 13C ratio found in the CaCO3 of the benthic foraminifera that live in the deeper waters.
Climate data is obtained by noting the changing spread between the δ13C found in the planktic foraminifera and the
δ13C found in the benthic foraminifera.
During a glacial advance, massive amounts of CO2 move from the atmosphere into the oceans. (This is the opposite situation to what we are currently
experiencing,- as we approach the peak heat of the Holocene Glacial Retreat.) Since the seaweed in the surface waters thrive on CO2 the seaweed population grows significantly.
So much so, it uses up vast amounts of the 12C in the surrounding surface waters, leaving an abundace of 13C for the planktic foraminifera to
incorporate into their shells. In the deeper waters where the benthic foraminifera live there isn't much sunlight for photosynthesis to take place, and the organic material that collects there is poor in
13C leaving a scant amount of 13C for the benthic foraminifera to incorporate into their shells. All this results in a much greater spread
between the δ13C in both types of foraminifera during a glacial advance than there is now.
In the 1950's, (when I was a science enthusiast in grade 5) an international consortium of scientists took seabed cores from all around the world. All their O2
analysis revealed the same climate history. This has since been verified by carbon isotope analysis of the same seabed cores.
Since we know the temperature range in which both types of foraminifera can live, this method has an intrinsic temperature reference allowing us to calculate the relative temperatures the isotope data
revealed,- as I did in appendix XI of my book where I determined that each Celsius degree of temperature equals 52.7 proxy degrees in the resulting climate plot.
The main problem with the seabed method is its sluggish response to climate change,- as it takes a long time for enough foraminifera shells containing a change in their isotopic composition to collect on
the seafloor in order to form a noticeable layer in the ocean's sediment.
All in all, the seabed method has provided us with an accurate low resolution climate history going back 2.5 million years.
The sluggish response of the seabed method to climate change prompted the search for a method with a faster response to climate change,- resulting in the development of the Ice Core Method with its
improved resolving power. Unfortunately, it has its own limitations, such as its inability to go back further in time than the last 650,000 years.
A sample of sea water taken from a depth of 500 feet in the Ocean near the equator called SMOW for Standard Mean Ocean Water is taken,
and the ratio between its 16O and 18O is carefully measured.
As the ocean waters near the equator evaporate, the evaporate will contain an oxygen isotope ratio similar to SMOW.
The clouds containing this moisture will migrate towards both poles.
As the clouds migrate, some of the heavier isotope of oxygen (18O) will rain out of them. The
name given to this type of separation of isotopes is "Equilibrium Isotope Fractionation".
The amount of isotope separation due to the many Equilibrium Isotope Fractionations while the clouds run the climate gauntlet from the equator to the poles is called "Rayleigh Fractionation".
By measuring the oxygen isotope ratios in the the polar ice, and comparing those ratios with SMOW, we can note the differing Rayleigh Fractionations over the years.
In a hotter climate, the Rayleigh Fractionation will be smaller as it will contain fewer Equilibrium Fractionation events. Here the climate's heat keeps most of the moisture in the sky.
In a colder climate, the Rayleigh Fractionation will be larger as it will contain more Equilibrium Fractionation events. Here it simply rains and snows a lot more.
Ice core temperature data can only be taken as warmer than, or colder than, some arbitrarily set data point. Mr. Gore reasoned, since the data
came from ice, he should set his zero temperature point close to the top of the curve determined from this method. He couldn't place it right at the top, as
that would bury us under mile thick ice at the present time.
As this method depends on the stability of the globe's wind patterns that move the moist clouds from the equator to the poles, and as the wind patterns are determined by the world's
"Hadley Cell Structure" which has only been stable for the last 650,000 years,- this method is limited to the last 650,000 years.
.
As there is some overlap in the time scale of both methods, it is possible to merge the properly adjusted ice core's curve with the seabed
curve to obtain a complete climate history going back 2.5 million years; which is what I did for the group of Hays, Imbrie, and Shakleton while I collaborated with them from the Regina Campus
of the University of Saskatchewan in 1970. That campus has since gained its autonomy becomming the University of Regina. The Nicholas J. Shakleton I collaborated with was the grandson of the famous Arctic explorer Sir Nicholas J Shakleton after whom he was named, and already
had his Phd degree. Seven years after our collaboration, he became the second Sir Nicholas J. Shakleton in the same family,- as he was knighted by H.R.M. Queen Elizabeth for his contributions to the infant science of Climatology. Follow this link to see my part in this collaberation.
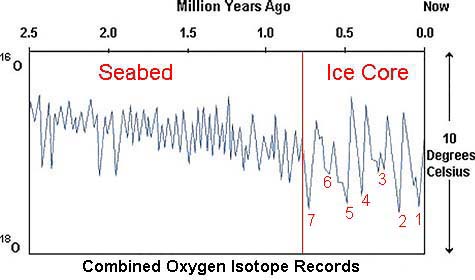
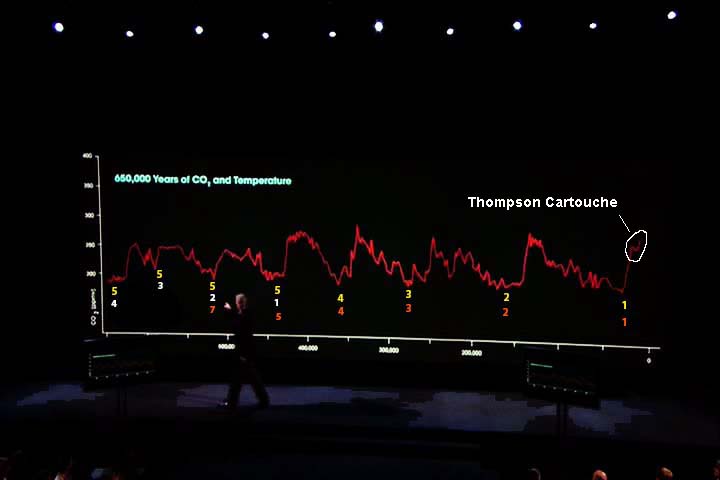
Below is a copy of my stiched together complete climate history going back 2.5 million years as used by Hays, Imbrie, and Shakelton
throughout their careers.
Here it is again showing the dividing line where I stiched the two curves together by hand as there were no desktop computers then. The
leftmost 1,850,000 years of the curve was determined from O2 Isotopes taken from the shells of both
Planktic and Benthic Foraminifera burried in the bed of the Beaufort Sea. The rightmost 650,000 year portion was determined from O2
isotopes in ice cores taken from Vostock, Antarctica. I have also numbered the glacial advances being spoken about in the following text:
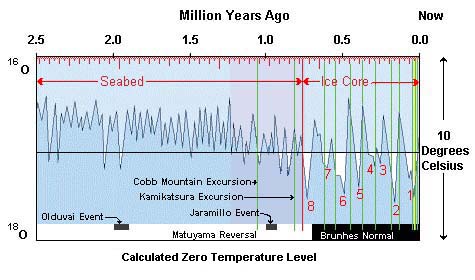
Unlike Al Gore, I did not set the zero temperature level of the Vostock curve near the top of the curve. I reasoned that since the curve
represents both the climate's hot and cold periods, the zero temperature should be placed near the mid-point between the curve's highest peak and lowest valley. The
comparison of my resulting curve with our known recent climate history as determined by studying glacial tills and other geological methods,- indicated I was correct. This
would enable me to tweak my placement of the zero temperature level to show the reason for an argument that had been raging among geologists for over a century.
The argument was over glacial advance #3. Some geologists claimed it was a single small advance with a pair of identically sized lobes.
Other geologists said that it was a pair of small almost identical glacial advances separated by a very tiny glacial retreat. Al Gore's placement of the zero temperature
level turns it into a large single glacial advance with a pair of fingers at its bottom extremity.
Moving my zero temperature level slightly upwards from my mid-point would settle the argument by making glacial advance #3 into a single small glacial
advance with a pair of lobes. This would still bury the tiny separating glacial retreat under ice. Moving my zero temperature level slightly downwards
from this mid-point would settle the argument by: 1) Shrinking the size of both small glacial advances. 2) Increasing the size of the tiny separating glacial retreat to a size that
would be too hard for anyone to ignore.
I joined the two curves to share a common zero temperature level at the 650,000 year time mark on he ice core's curve, (see Appendix XV in my book) and
tweaked my zero temperature level using the mid-point between the highest peak of the seabed portion with the lowest valley of the ice core portion. This combined adjustment
hardly moved my zero temperature level in the ice core portion at all. It was now correctly placed at such a level as to show the reason for the above argument. Directly
below is a colorized and labled version I used in my book to show the Earth's magnetic epochs, events, and excursions. As determined in Appendix I, these do not trigger
glacial advances as some people think.
As mentioned before, there was an argument among geologists as to the reality of glacial till between the two lobes of glacial advance #3. If the debris
found here was glacial till,- then this advance had shrunk from a larger advance. If the debris found in this place was not glacial till, then this would have been two closely
spaced separate advances. I placed my zero temperature level here to show the reason for the argument, not to settle the argument.
Many geologists in the late 1960's were unaware of the argument, which by then had been settled with the confirmation the debris was glacial till. There
were still some hold outs who argued that the two separate advances were so close,- their tills both mingled together later on.
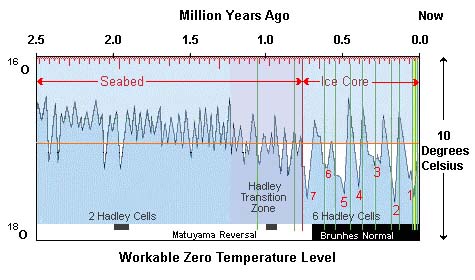
The following tweak shows the accepted view that advance #3 was a single advance with two lobes. This yields seven glacial advances in the last
650,000 years.
Now let's see what happens when you place the zero temperature where Al Gore placed it:
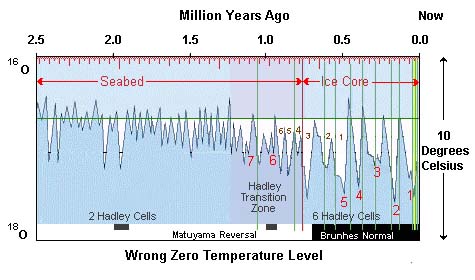
This not only swallows up the tiny glacial retreat argued about re glacial advance #3, but also many other well established glacial retreats. The resulting
glacial advance #5 merges with advances 6, 7, and three more advances from the seabed record,- into the six lobed single mega-glacial advance #5 we know never existed.
Obviously placing the zero temperature this high leads to an erroneous climate history.
Since the range of temperatures over which the many species of foraminifera can live and incorporate oxygen into their shells is known to be 10 degrees celsius; we can
determine the temperatures in the curve with great accuracy.
It also turns the "monsoonal rain period of the seabed record into numerous glacial advances that never occured, and reduces the total number of glacial
advances in the last 650,000 years to only five.
Please note I have renumbered the glacial advances in this image accordingly, but only numbered the six lobes in glacial advance #5. There are three
unnumbered lobes in the new advance #6, and four unnumbered lobes in the new advance #7.
I have colored Mr. Gore's zero temperature level green. I have also labled both stable Hadley Cell structures, and colored the unstable Hadley Transition Zone
between them,- mauve.
In Appendix I of my book I found the entire curve from the hottest to the coldest points in our 2.5 million year climate history occurred while the foraminifera
experienced a temperature range of only 5.69 degrees celsius. Thus I determined a single degree celsius contains 52.7 proxy degrees of temperature which rounds off to 50 proxy degrees.
The inverse being a single proxy degree is 1/50th of a celsius degree. I believe Mr. Gore abused this relationship in his famous demonstration of where our
temperatures are heading,- requiring the use of a gondola lift.
If you have seen Mr. Gore's movie "An Inconvenient Truth": you may wish to argue my climate curves don't look like his. The reason is all my climate curves
had to fit on the same page his curve just fit. Our horizontal scales fitting the same page are vastly different. My curves encompass 2.5 million years while his only covers
0.65 million years,- as demonstrated in my following video clip.
How do I know Mr. Gore set his zero temperature level at the above wrong level? He tells me so in his movie.
Look at the following few frames I have isolated from his movie, and note: while he enumerates our past glacial advances, the vertical line marking the end of his plot
is positioned in the first lobe of his glacial advance #5 he calls the fifth ice age back. This is far too short of the 650,000 years of the plot
Oddly enough, when the 650,000 year mark of the plot is reached, we should only have gone back to the 3rd lobe of his erroneous 6 lobed advance. Yet here we are
still at the first lobe of the 5th glacial advance encountering an end-of-curve vertical line.
I have captured the frame of Mr. Gore pointing to the first lobe of the glacial advance he calls the fifth ice age back. Here I numbered the visible glacial
advances in yellow, their associated lobes in white, and Mr. Gore's enumeration of them as ice ages in orange.
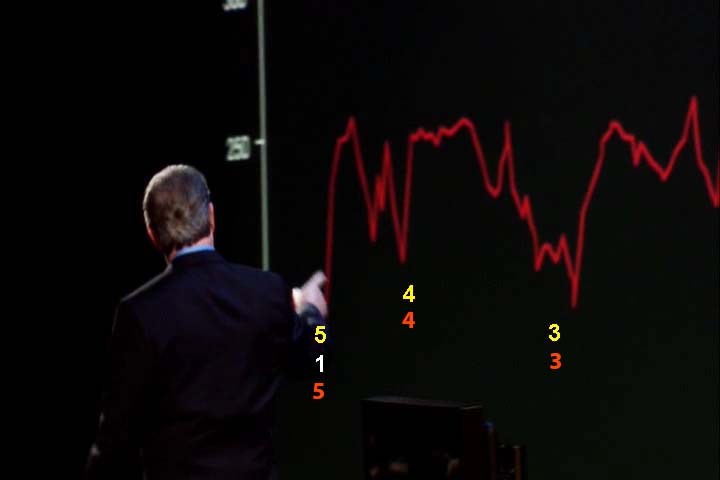
Mr. Gore passes this end-of-curve line to count an invisible 2nd lobe of glacial advance #5 he calls ice age number six. I have shown him pointing to this
invisible glacial advance below.

Immediately following this, he switches our view to one that places the end-of-curve line closer to where it belongs. Here he points again to the 2nd lobe of
glaciation #5 which he should be calling in his own vernacular, ice age #6. But he has already used that number, so he vocalizes it as ice age number seven. Here he does not enumerate the remaining
two lobes of glacial advance #5.
Is Mr. Gore an idiot? I think not. He realizes his misplaced zero temperature level presents impossible results and hides this fact by claiming it produces
the numbering that results from a better placement of the zero temperature level. He wants to eat his cake and have it too.
Lest you feel I have been taking things out of context, here is the entire segment from his movie:
I hope you noticed Mr. Gore claiming the entire curve at the end, from top to bottom, represents "This much ice" over the heads of Americans living in the Northern Tier.
That places his zero temperature level exactely where I said he put it, and introduces all the faults I revealed about using such a high zero temperature level. Moreover, it clearly demonstrates
Mr. Gore and his supporters at the UNIPCC do not have a handle on our climate history.
There are three more things Mr. Gore said that deserve our attention:
1) In showing us the completely phony 1,000 year climate taken from mountain ice (see "A Faulty Question"
in the "My Book" section of this website) he draws attention to the "Medieval Warming" as though it was supposed to be a climate cycle. Take a look at a real climate cycle: One whole
climate cycle on the Vostock Curve is the distance from the beginning of one glacial advance to the beginning of the next glacial advance in either direction. The Medieval Warming would not
even show up as a squiggle on this curve.
2) The Medieval Warming is properly described as a climatic event as it leaves the climate in much the same condition as it was when the event began.
Climatic events can never leave a climate in exactlly the same condition it was in before the event began,- as climates are not static.
3) Mr. Gore knows for sure that the CO2 and temperature rise and fall together because the CO2 was trapping the heat. Take out the
"because......" and replace it with "since both of them are produced by the undersea volcanoes at the same time" and you will arrive at the crux of the matter.
Mr. Gore, remember this?